Difference between revisions of "Applications of AirNOW Data"
(→NAAQS) |
|||
| Line 77: | Line 77: | ||
===NAAQS=== | ===NAAQS=== | ||
| + | |||
| + | The current National Ambient Air Quality Standards for PM2.5 and PM10 are exxpressed in terms of daily and yearly averages. However, it is anticipated that in the future the PM standards will also be expressed in shorter time units, similar to the 8-hour ozone standard. In order to develop those standards the AIRNow network can serva as a testbed for exploring the alternative forms of a new standard. | ||
| + | |||
| + | A recently added provision of the NAAQS for PM2.5 and ozone is the Exceptional Event Rule. It permits States to flag certain events as exceptional, such that those data are not considered in the complience calculations. Natural events such as smoke from major fires and dust are the main contributors to exceptional events. An obligation of the States is to provide appropriate documentation that an event is exceptional as defined by the Rule. For that documentation, the short-term observations for AIRNow provide a particularly and important source of evidence. More information on the EE Rule and its implementation can be found on the ESIP Exceptional Event Workspace. | ||
| + | |||
[http://scholar.google.com/scholar?num=100&hl=en&lr=&q=AIRNow+NAAQS Google Scholar - AIRNow and NAAQS] | [http://scholar.google.com/scholar?num=100&hl=en&lr=&q=AIRNow+NAAQS Google Scholar - AIRNow and NAAQS] | ||
* Regulatory (Except Event) | * Regulatory (Except Event) | ||
Revision as of 13:08, February 29, 2008
What links here: Applications of AirNOW Data
Example Application: AirNOW
AirNOW is a modern information system that collects and federates the monitoring data from hundreds of continuous air quality monitors operated autonomously by various agencies, mostly U.S. states. On the output side, the primary purpose of AirNOW is to deliver air quality status and forecast to the public. In-between is the AirNOW information systems that transforms the incoming raw data into usable, actionable knowledge. For more information, the reader is referred to the AirNOW and AirNOW Tech websites. A structured description of the AIRNow data system can be found on the AirNOW profile. A community workspace, the AIRNOW dataspace, facilitates the gathering of community contributed comments, resources, and feedback related to AirNOW.
The AIRNow program can deliver real-time ozone and PM2.5 concentration data to many different applications spanning several societal benefit areas including, health and ecological effect, disasters, and others. Conversely, fully informing the public can benefit from many data sets and analysises beyond those federated by the AirNOW system. For this reason, AirNOW represents an attractive application of the fan in - fan out networked information architecture adapted by GEOSS and by the EPA Air Quality Data Summit?
Public Information
Delineating the numerous pathways in which the AirNOW data are transmitted to the public is beyond the scope of this report.
Pollutant Characterization
Daily, Weekly, Seasonal Cycles for AIRNow PM10 and PM2.5
- PM10(black), PM25(red)Using DataFed Data Access, Filtering, Aggregation and Visualization Services
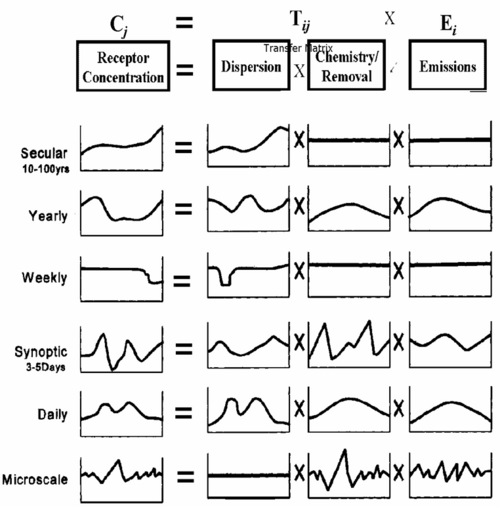
The AIRNow data are uniquely suitable to characterize the short-term pattern of PM2.5, ozone, and other parameters measured. A particularly useful outcome is a description of the diurnal and weekly pattern which is strongly influenced by the corresponding pattern of the emissions from major mobil and point sources. The images below illustrate the diversity of the pollutant diurnal, weekly, and seasonal pattern as derived from the AIRNow database for PM2.5.
The calculation of the diurnal, weekly, and seasonal pattern as well as the long-term trends can be calculated by reusable software components that are applicable to virtually all point monitoring data sets. When combined with suitable data access and rendering services these components can be added to a pool of reusable core services. These services could then be registered in GEOSS registries and catalogs as offerings to the GEOSS community. An implementation of the Service Orineted Approach is through the DataFed workflow engine. The actual qorkflow program is shown in Figure...
371830014 Raleigh, NC


481410037 ElPaso, TX


040139812 Durango, AZ


Health/Exp. Assessment
In recent years the health effects of air pollutants in the U.S. are primarily attributed to surface ozone and fine particles. The AirNOW network provides monitoring data for these two pollutants. The companion network is the regulatory network which uses daily average filter samples, collected every third day to characterize the PM2.5 pattern. Health exposures during short-term fine particle peaks, lasting a few hours, and the exposure during the off days cannot be estimated from the regulatory PM2.5 FRM sampling network. In the past, epidemiological and event-based health studies had to rely on PM2.5 surrogates such as visibility data to associate health effect measures with the corresponding PM2.5 exposure.
For this reason the continuous measurements of PM2.5 allows better association of health and pollution signals. This in turn should permit the development of more suitable air quality standards for PM2.5. The continuous AirNOW monitoring data for ozone is compatible to the continuous ozone monitors in the regulatory ozone network.
Google Scholar Search - AirNOW and health
Emissions Estimation and Planning
An interesting application of the hourly AirNOW data pertains to improved estimation of emissions. The short time-resolution of the AIRNow monitors can charecterize the concentration variability, such as the diurnal cycle and concentration pulses. Many local sources such as automobile traffic have strong diurnal cycles driven by the traffic intensity and atmospheric dispersion characteristics. Comparing the diurnal cycle of neighboring sites with and without local source allows the estimation of the added local contribution.
In some cases, such as fires and dust events, the emission source causes a transient pulse at nearby receptor sites that may last only a few hours. In that case, comparison of mearby impacted and un-impacted sites provides a measure of the transient source strength.
In both of the above examples the estimation of the source strength requires the use of inverse modeling techniques in which the emission sources inferred from the measured concentration field and model-simulated transport characteristics. In fact, in case of natural smoke and dust events, such inverse modeling approach is the only known technique for estimating the source strength. The schematics of an observation-modeling system for biomass smoke estimation is shown in Figure ???.
Google Scholar Search - AirNOW and Emission
AQ Trends and Accountability
Analyzing the trends of emissions and ambient concentrations provide the means for evaluating the effectivness of control strategies. In the past, the air pollution trends were evaluated primarily by the analysis of the EPA FRM long-term monitoring network data. The short monitoring period of AIRNow data (2002-) precluded the use of the AIRNow data for trend analysis. However, as the continuous monitoring data accumulate it will be possible to incorporate AIRNow data into the trend analysis, particularly for the changes and diurnal and other short-term concentration pattern.
Google Scholar Search - AirNOW and Trend
Intercontinental Transport Policy
Detecting and quantifying intercontinental transport requires a diverse set of sensors, data nalysis tecniques and models. THe short resolution PM2.5 and ozone data constitute an important addition to the sensor pool. The applications of AIRNow data is most promising for LRTP detection at receptor sites, such as those over the western US detecting transport from Asia in April, sites in Texas detecting Central American smoke in May and Sahara dust in July.
Google Scholar Search - AirNOW and Intercontinental Transport
Science Support
Vertical Transport: Air quality monitoring with fine time resolution sensors can provide significant insights for the characterization of atmospheric processes such as vertical transport. Here again, the diurnal cycle of a given pollutant can reveal whether a substance is emitted from the ground, or is it transported downward from elevated pollutant layers. Elevated pollutant layers, such as those arising from long-range transport, tend to produce surface concentration pattern which peak during the daytime period when the mixing is strongest. At night, those layers are generally decoupled from the surface and dry deposition tends to deplete the concentration in the shallow nocturnal boundary layer. An example for such a case was documented during the April,1998 Asian dust event as it impacted the PM10 concentrations. Figure?? shows virtually identical diurnal pattern observed by a cluster of ten monitoring sites near Sacramento, CA. The high concentration plateau corresponds to the time when the daytime mixing caused the downwash of the elevated layer while the nighttime decay shows the role of dry deposition of dust in the nocturnal PBL.
Data Fusion: Characterization Data Fusion
NAAQS
The current National Ambient Air Quality Standards for PM2.5 and PM10 are exxpressed in terms of daily and yearly averages. However, it is anticipated that in the future the PM standards will also be expressed in shorter time units, similar to the 8-hour ozone standard. In order to develop those standards the AIRNow network can serva as a testbed for exploring the alternative forms of a new standard.
A recently added provision of the NAAQS for PM2.5 and ozone is the Exceptional Event Rule. It permits States to flag certain events as exceptional, such that those data are not considered in the complience calculations. Natural events such as smoke from major fires and dust are the main contributors to exceptional events. An obligation of the States is to provide appropriate documentation that an event is exceptional as defined by the Rule. For that documentation, the short-term observations for AIRNow provide a particularly and important source of evidence. More information on the EE Rule and its implementation can be found on the ESIP Exceptional Event Workspace.
Google Scholar - AIRNow and NAAQS
- Regulatory (Except Event)
- Regional Haze Rule (RPO)
NASA Applications of Air Quality Data
NOAA Applications of Air Quality Data
Model Eveluation (Assimilations/Verification)


