Difference between revisions of "Obs Emiss Model Assimilation"
| Line 13: | Line 13: | ||
==Observation-Emision Links== | ==Observation-Emision Links== | ||
| − | [[Image:071124_OMINO2_Avg.PNG| | + | [[Image:071124_OMINO2_Avg.PNG|500px]] [[Image:071124_OMINO2_Mobile.PNG|500px]] [[Image:071124_OMINO2_Point.PNG|500px]] |
| Line 25: | Line 25: | ||
==Point Sources over the Western US== | ==Point Sources over the Western US== | ||
| − | [[Image:071124_OMINO2_PointWest.PNG| | + | [[Image:071124_OMINO2_PointWest.PNG|500px]] [[Image:071124_OMINO2_PointWestPoint.PNG|500px]] |
In the Western US, individual power plants, most notable the Four Corners plant, are clearly discernable by impact on their surroundings | In the Western US, individual power plants, most notable the Four Corners plant, are clearly discernable by impact on their surroundings | ||
==Georgia Smoke NO2 Emisssion== | ==Georgia Smoke NO2 Emisssion== | ||
| − | [[Image:071124_OMINO2_GASmokeAvg.PNG| | + | [[Image:071124_OMINO2_GASmokeAvg.PNG|500px]] [[Image:071124_OMINO2_GASmokeMobil.PNG|500px]] |
Non-industrial sources of NOx are also detectable in the OMI NO2 climatology. The impact of the S. Georgia fire in May 2007 is clearly quantifyable. | Non-industrial sources of NOx are also detectable in the OMI NO2 climatology. The impact of the S. Georgia fire in May 2007 is clearly quantifyable. | ||
| Line 37: | Line 37: | ||
==Idaho Smoke NO2 Emission== | ==Idaho Smoke NO2 Emission== | ||
| − | [[Image:071124_OMINO2_IdahoSmoke.PNG| | + | [[Image:071124_OMINO2_IdahoSmoke.PNG|500px]] |
The regular biomass burning in the Northwestern US has also quantifiable impact on the tropospheric NO2. Such data can be evaluated to generate improved emission inventories for NOx. | The regular biomass burning in the Northwestern US has also quantifiable impact on the tropospheric NO2. Such data can be evaluated to generate improved emission inventories for NOx. | ||
==Weekday Weekend Emission == | ==Weekday Weekend Emission == | ||
| − | [[Image:071124_OMINO2_WeekdayWeekend.PNG| | + | [[Image:071124_OMINO2_WeekdayWeekend.PNG|500px]] |
The daily time resolution of the OMI NO2 data allows the quantification of the weekday-weekend effect. For example, in large metropolitan areas, the Friday NO2 exceeds the Sunday values by a factor of 1.2-1.4. This again can aid the development of higher time resolution emission inventories for NOx. | The daily time resolution of the OMI NO2 data allows the quantification of the weekday-weekend effect. For example, in large metropolitan areas, the Friday NO2 exceeds the Sunday values by a factor of 1.2-1.4. This again can aid the development of higher time resolution emission inventories for NOx. | ||
| Line 48: | Line 48: | ||
==Emission_Model_Link== | ==Emission_Model_Link== | ||
| − | [[Image:071124_OMINO2_Emission_Model_Link.PNG| | + | [[Image:071124_OMINO2_Emission_Model_Link.PNG|500px]] |
Elevation, Weekly, Diurnal Cycle.... | Elevation, Weekly, Diurnal Cycle.... | ||
==Nudging Example== | ==Nudging Example== | ||
| − | [[Image:071124_OMINO2_NudgingExample.PNG| | + | [[Image:071124_OMINO2_NudgingExample.PNG|500px]] |
Spatial displacement, Concentration scaling... | Spatial displacement, Concentration scaling... | ||
| Line 59: | Line 59: | ||
==OMI Data Issues == | ==OMI Data Issues == | ||
| − | [[Image:071124_OMINO2_OhioNewYork.PNG| | + | [[Image:071124_OMINO2_OhioNewYork.PNG|500px]] |
However, there are also significant questions to be explored. | However, there are also significant questions to be explored. | ||
| Line 65: | Line 65: | ||
Why is the OMI NO2/EPA Emission ratio 40% higher over the Eastern megalopolis than over the Ohio River Valley? | Why is the OMI NO2/EPA Emission ratio 40% higher over the Eastern megalopolis than over the Ohio River Valley? | ||
| − | [[Image:071124_OMINO2_TropoStratoSeparation.PNG| | + | [[Image:071124_OMINO2_TropoStratoSeparation.PNG|500px]] |
Also, why does the Stratospheric NO2 from OMI exhibit ‘NO2 holes’ over the major Easter cities in some of the months? | Also, why does the Stratospheric NO2 from OMI exhibit ‘NO2 holes’ over the major Easter cities in some of the months? | ||
| Line 71: | Line 71: | ||
==OMINO2_GlobalOMIModelMap== | ==OMINO2_GlobalOMIModelMap== | ||
| − | [[Image:071124_OMINO2_GlobalOMIModelMap.PNG| | + | [[Image:071124_OMINO2_GlobalOMIModelMap.PNG|500px]] |
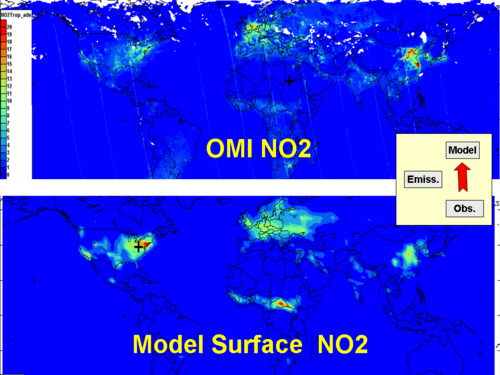
The available OMI NO2 data and the results of NO2 models will allow a global-scale comparison. | The available OMI NO2 data and the results of NO2 models will allow a global-scale comparison. | ||
This new opportunity will permit the global-scale reconciliation of the models-emissions and observations. | This new opportunity will permit the global-scale reconciliation of the models-emissions and observations. | ||
==Surface - Satellite - Model Intercomparison== | ==Surface - Satellite - Model Intercomparison== | ||
| − | [[Image:071124_OMINO2_SurfOMIModelTime.PNG| | + | [[Image:071124_OMINO2_SurfOMIModelTime.PNG|500px]] |
Model Observation comparison: Temporal pattern | Model Observation comparison: Temporal pattern | ||
Revision as of 21:46, November 24, 2007
Data Assimilation Framework
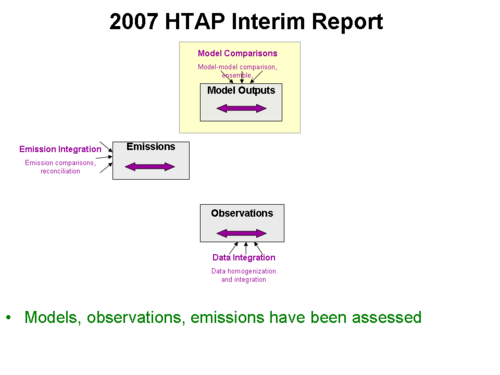
The 2007 Interim Report [1], the available HTAP-relevant global models, observations and emissions were assessed. The HTAP community has made particular contributions toward the intercomparison of global models.
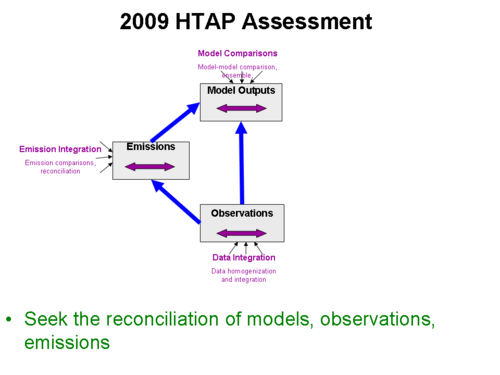
The 2009 HTAP Assessment seeks to reconcile the models with observations and emissions.
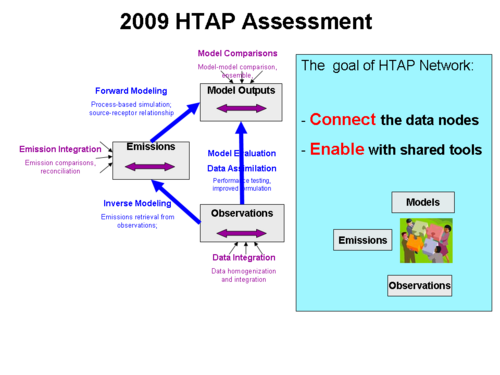
This broader reconciliation will require the interaction of domain experts in all three areas, as well as the seamless flow of data among the participants. A network that facilitates human-human as well as computer-computer interaction is desired.
The main goal of the HTAP network is to facilitate the human and data connectivity. Given the connectivity, we wish to enable the participants with shared tools and methods.
Observation-Emision Links
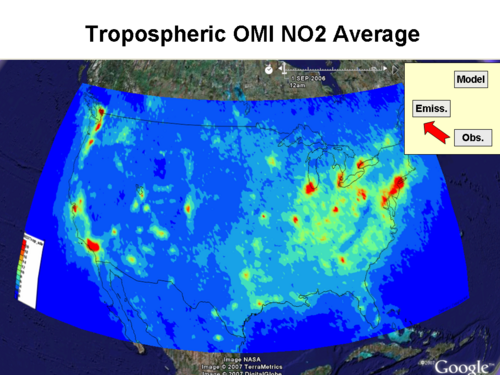
It is now possible to develop a chemical climatology (2004-7) of tropospheric NO2 based on routine daily satellite observations. The data show a highly patchy pattern over the Contiental US.
Such data can aid the understanding of NO2 sources, atmospheric dynamics and potential impacts on human health and welfare.
Superposition of mobile emission sources on the climatotlogical OMI NO2 shows that most of the observed NO2 hotspots are indeed over metropolitan areas where automotive emissions of NOxare domiant.
A broader elevated tropospheric NO2 is observed over the Ohio River valley, where a string of power plants are responsible for significant NOx emissions. However, additional hotspots are also observed over known individual power plants in the western and southeastern US.
Point Sources over the Western US
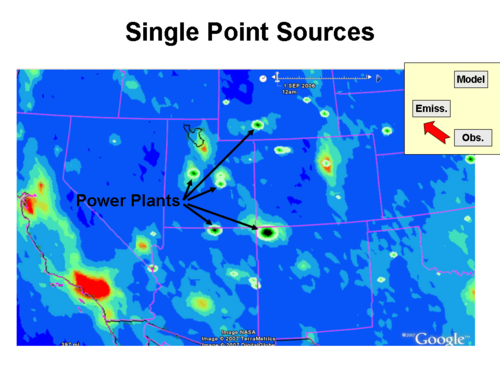
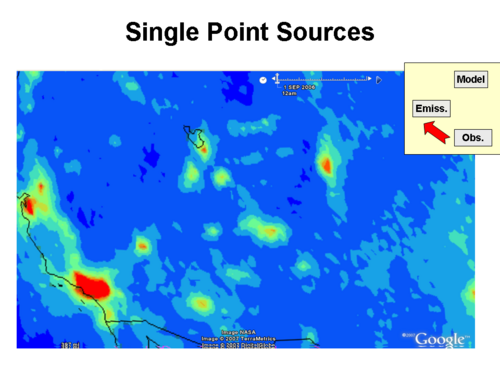
In the Western US, individual power plants, most notable the Four Corners plant, are clearly discernable by impact on their surroundings
Georgia Smoke NO2 Emisssion
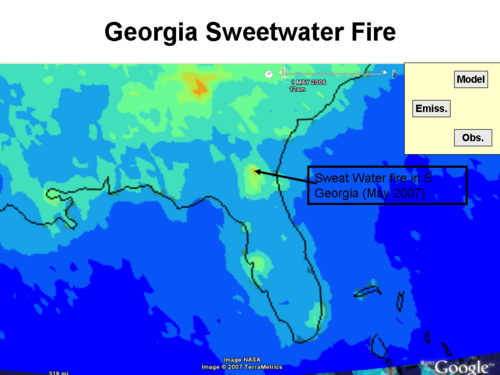
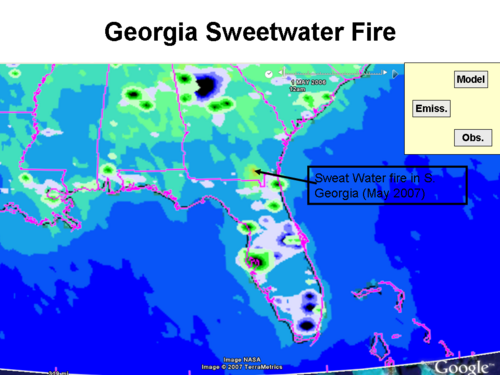
Non-industrial sources of NOx are also detectable in the OMI NO2 climatology. The impact of the S. Georgia fire in May 2007 is clearly quantifyable.
It is evident, that the fire emission can be spatially separated from the urban and power plant emissions.
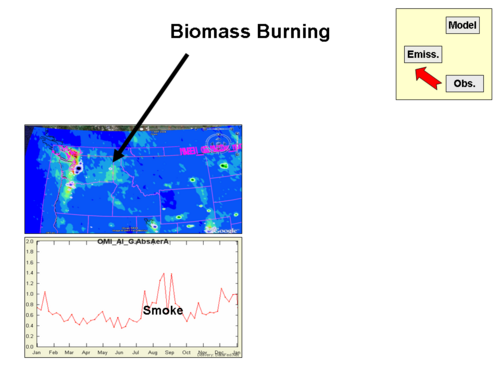
Idaho Smoke NO2 Emission
Weekday Weekend Emission
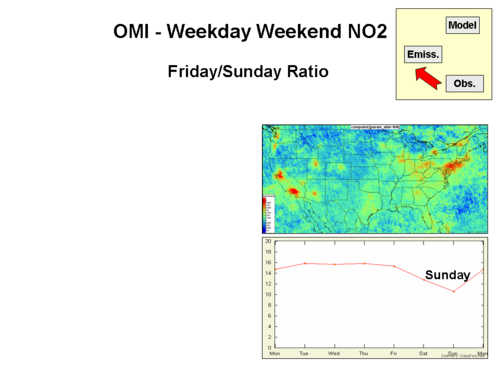
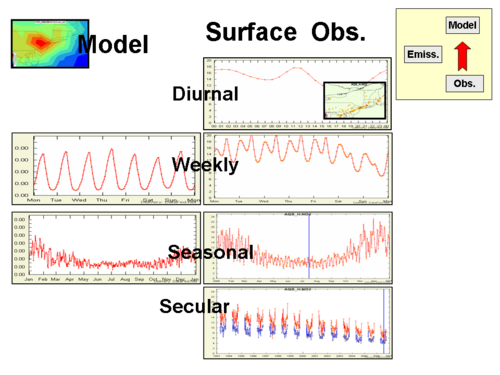
The daily time resolution of the OMI NO2 data allows the quantification of the weekday-weekend effect. For example, in large metropolitan areas, the Friday NO2 exceeds the Sunday values by a factor of 1.2-1.4. This again can aid the development of higher time resolution emission inventories for NOx.
Emission_Model_Link
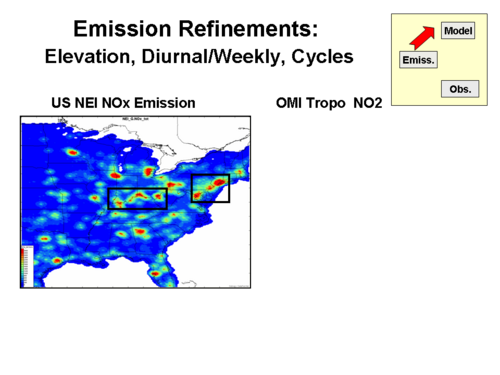
Elevation, Weekly, Diurnal Cycle....
Nudging Example
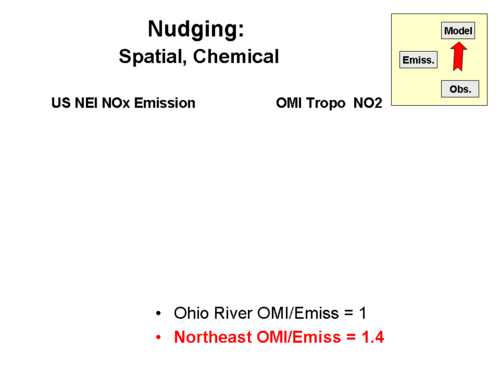
Spatial displacement, Concentration scaling...
OMI Data Issues
However, there are also significant questions to be explored.
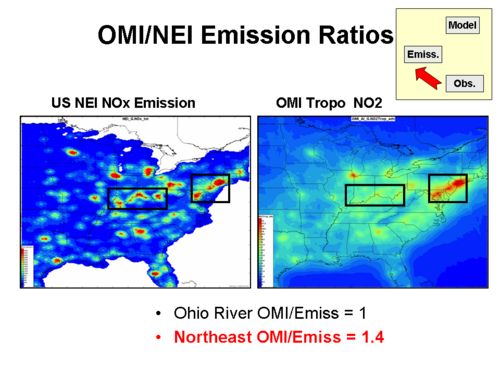
Why is the OMI NO2/EPA Emission ratio 40% higher over the Eastern megalopolis than over the Ohio River Valley?
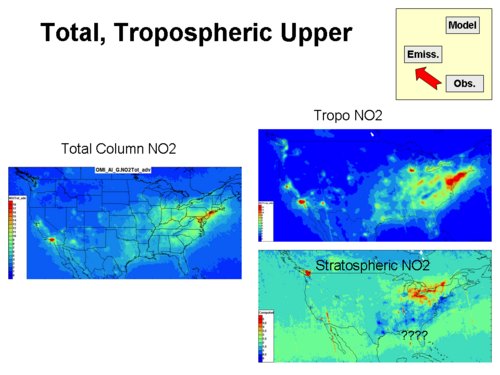
Also, why does the Stratospheric NO2 from OMI exhibit ‘NO2 holes’ over the major Easter cities in some of the months? Is the Total NO2 column split properly between the troposphere and stratosphere?
OMINO2_GlobalOMIModelMap
