Difference between revisions of "Evidence for Flagging Exceptional Events"
| Line 38: | Line 38: | ||
'''Links to Satellite Sensors showing Ga/Fl fire on May 13, 2007:''' | '''Links to Satellite Sensors showing Ga/Fl fire on May 13, 2007:''' | ||
| + | * [http://webapps.datafed.net/datafed.aspx?page=ARC/NOAA_HMS_FirePix&datetime=2007-05-13T18:00:00 HMS Fire Pixels] <br>[[Image:HMS_FirePix.png|400px]] | ||
| + | * [http://webapps.datafed.net/datafed.aspx?page=ARC/OMI_AI&datetime=2007-05-13T18:00:00 OMI AI] <br>[[Image:OMI_AI.png|400px]] | ||
| + | * [http://webapps.datafed.net/datafed.aspx?page=ARC/MODIS_AOT&datetime=2007-05-13T18:00:00 MODIS AOT] <br>[[Image:MODIS_AOT.png|400px]] | ||
* MODIS OnEarth | * MODIS OnEarth | ||
| + | ** [http://webapps.datafed.net/datafed.aspx?page=ARC/MODIS_Terra_RGB_OnEarthJPL&datetime=2007-05-13T18:00:00 Terra] <br>[[Image:MODIS_Terra.png|400px]] | ||
** [http://webapps.datafed.net/datafed.aspx?page=ARC/MODIS_Aqua_RGB_OnEarthJPL&datetime=2007-05-13T18:00:00 Aqua]<br>[[Image:MODIS_Aqua.png|400px]] | ** [http://webapps.datafed.net/datafed.aspx?page=ARC/MODIS_Aqua_RGB_OnEarthJPL&datetime=2007-05-13T18:00:00 Aqua]<br>[[Image:MODIS_Aqua.png|400px]] | ||
| − | |||
| − | |||
| − | |||
* [http://webapps.datafed.net/datafed.aspx?page=ARC/OMI_NO2Trop&datetime=2007-05-13T18:00:00 OMI NO2] <br>[[Image:OMI_NO2.png|400px]] | * [http://webapps.datafed.net/datafed.aspx?page=ARC/OMI_NO2Trop&datetime=2007-05-13T18:00:00 OMI NO2] <br>[[Image:OMI_NO2.png|400px]] | ||
| − | + | ||
''' Model Simulations''' | ''' Model Simulations''' | ||
Revision as of 23:40, April 10, 2008
< Back to Exceptional Event Workspace
What Evidence is Required to Flag an Exceptional Event? (EE)
The Exceptional Events Rule requires states that flag data to satisfy the requirements of 40 CFR 50.14 (c)(3)(iii) to provide evidence that:
- The sample is a likely exceedance
- The event satisfies the criteria that it was not reasonably controllable or preventable
- There would have been no exceedances or violation but for the event.
- The event is associated with a measured value in excess of historical values.
- There is a clear casual relationship between the measured value and the event
In the following analysis, we will use the May 2007 Georgia Swamp Fire to illustrate the impact of an exceptional event on the PM2.5 concentration over the eastern U.S. The smoke from this event has impacted multi-state regions, which are also receptors of major anthropogenic sulfate sources. The tools and methods illustrated here allow the determination of which potential exceedances are attributable to the exceptional event and anthropogenic sources, respectively. The illustrative analysis will focus on May 24, 2007.
1. Is there a likely exceedance?
The first step is to establish that a sample is a likely contributor to noncompliance. Exceptional events flags are appropriate for samples that are likely to cause an exceedance. A site is in noncompliance if the 98 percentile of the PM2.5 concentration over a three year period is over 35 ug/m3. However, a site is in compliance if the number of PM2.5 > 35ug/m3 samples is less than 2 percent.
Screening for Potential PM2.5 Exceedances
The PM2.5 samples that are potential contributors to non-compliance can be determined visually by the PM2.5 Exceedance Screening Tool. The data browser tool has a map view and a time series view. The map view shows the PM2.5 concentration as colored circles for each station for a specific date. The time view of the browser shows the concentration time series for a selected site. The selection of time for the map view can be accomplished by entering the desired date in the date box or clicking the date in the time view. The selection of the station for the time series is accomplished either by choosing from the station list box or clicking on the station in the map view.[ Description of generic DataFed browser] The coloring of the PM2.5 concentration values (circles) is adjusted such that the concentrations above 35ug/m3 are shown in red. This provides an easy and obvious (to everyone except Neil) way to identify the candidate samples for noncompliance.

Conclusion: It is evident that on May 24, 2007 a large swath of the eastern U.S. had PM2.5 concentration above 35ug/m3. However, the PM2.5 mass measurements do not reveal whether these potential exceedances were due to exceptional causes.
2. Not Reasonably Controllable or Preventable
This line of evidence needs to establish that the event is 'not reasonably controllable or preventable'. The EE Rule identifes different categories of uncontrollable events:
- Exceedances Due to Transported Pollution (Transported African, Asian Dust; Smoke from Mexican fires; Smoke & Dust from Mining, Agricultural Emissions)
- Natural Events (Nat. Disasters.; High Wind Events; Wildland Fires; Stratospheric Ozone; Prescribed Fires)
- Chemical Spills and Industrial Accidents; Structural Fires; Terrorist Attack


Screening for Causes
Satellite Sensors Satellite images and satellite-derived aerosol products have been shown to be useful for the identification of exceptional events such as biomass burning and forest and agricultural fires, wind-blown dust events. Most of those images and products are available in near-realtime. A limitation of the satellite data is that they are semi-quantitative, particularly for estimating surface concentrations. Furthermore, satellite observations of surface-based aerosols are not available under cloudy conditions. Examples....
Links to Satellite Sensors showing Ga/Fl fire on May 13, 2007:


Model Simulations
Model simulations and forecasts may also provide evidence for exceptional events. For example, the ability of regional and global-scale models for forecasting wind-blown dust events is continuously improving. This is evidenced by the good performance of the Naval Research Laboratory NAAPS global dust model. The simulation and forecasting of major smoke events is much more difficult due to the unknown space-time dependence of the smoke emissions. Hence, currently reliable and tested smoke forecast models do not exist.
NAAPS Dust Model 2006-01-01 Texas Dust.

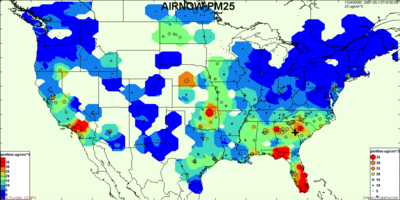
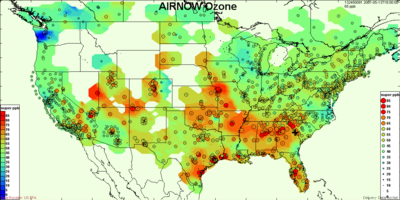
Auxiliary Observations In many areas quantitative observations of PM2.5 are available through additional monitoring networks, most notably the AirNOW real-time network. In some areas there are also local monitoring stations that can augment the large-scale observations. Sun photometers, measuring the vertical aerosol optical thickness, fall in this category.
- Airnow PM2.5 2007-05-13
- Airnow Ozone 2007-05-13


Qualitative Observations Exceptional events are inherently noticeable because of the intensity of the short-time emissions and due to the unusual impacts they have on the atmospheric environment. The recent proliferation of continuously recording webcams, individual digital photographs and home videos as well as personal blog reports now constitute a significant new information source. Since most of these observations are almost immediately placed on the internet with YouTube, flickr, technorati. Given the high density and short response of these sensors to the exceptional events it is said that the Earth, 'has now acquired a skin for the detection of changes in the environment.'
Automatic Harvesting of Florida Smoke-relavent Resources
Blogs with tags Florida + Smoke posted between 2007-05-07 to 2007-05-12.
- Google Blog Search: Florida + Smoke
- Flickr: Florida+Smoke
Additional Human Filtering of Automatically Harvested Resources
By scanning the harvested resources (blogs and videos) deamed relevant to event analysis were tagged in del.icio.us. This added an additional human selection beyond automatic harvesting.
- Del.icio.us: 070508+Florida+Smoke
- Del.icio.us: 070508+Florida+Smoke+video
- YouTube: 'Florida+Smoke' Harvest
- Canadian Smoke Event Analysis - Jun/Jul 2006 uploaded to YouTube
Backtrajectory Analysis
Given the availability of FRM PM2.5 concentrations, it is instructive to examine the backtrajectories (air mass histories) associated with above-standard concentrations. If those backtrajectories pass through areas of known exceptional sources (forest fires, dust storms), then the corresponding high concentrations may be attributed to that event.
On the other hand, if the backtrajectories pass through known anthropogenic emission regions, then those sources are likely responsible. Also if the backtrajectories indicate slow air mass motion in the vicinity of the receptor then atmospheric stagnation may be responsible for the accumulated high values. Note: links to examples of different backtrajectories.
CATT FRM PM2.5 2007-05-24

Conclusion: It is evident that on May 24, 2007 a large swath of the eastern U.S. had PM2.5 concentration above 35ug/m3. However, the PM2.5 mass measurements do not reveal whether these potential exceedances were due to exceptional causes.
3. The Exceedance or Violation would not Occur, But For the Exceptional Event
According to the EE Rule, observationas can be EE-flagged if the violation is caused by the exceptional event.
- The leftmost figure shows a case when the 'exceptional' concetration raises the level above the standard. A valid EE to be flagged.
- In the next case, the concentration from controllable sources is sufficient to cause the exceedance. This is not a 'but for' case and should not be flagged.
- In the third case, there is no exceedance. Hence, there is no justification for an EE flag.


Illustration Exceptional Events, EE and non-EE events by the EE Rule.
Conclusion: It is evident that on May 24, 2007 a large swath of the eastern U.S. had PM2.5 concentration above 35ug/m3. However, the PM2.5 mass measurements do not reveal whether these potential exceedances were due to exceptional causes.
4. The Event is in excess of the Historical Values


Conclusion: It is evident that on May 24, 2007 a large swath of the eastern U.S. had PM2.5 concentration above 35ug/m3. However, the PM2.5 mass measurements do not reveal whether these potential exceedances were due to exceptional causes.
5. Clear Causal Relationship between the Data and the Event
There are multiple lines of evidence that can support the relationship between observations and the event. In the Exploratory Study the following lines of evidence were suggested:
- Chemical Signature
- Observed Pollutant Source and Transport
- Spatial Pattern of Pollutant
- Temporal Pattern of Pollutant
However, additional lines of evidence should be considered and illusterated. Community participation would be most desirable.
Conclusion: It is evident that on May 24, 2007 a large swath of the eastern U.S. had PM2.5 concentration above 35ug/m3. However, the PM2.5 mass measurements do not reveal whether these potential exceedances were due to exceptional causes.