2007-07-22: OMI Applications and Data
OMI Demo at Summer 2007 ESIP: Progress Report, June 1, 2007
R. B. Husar, K. Hoijarvi, E. Robinson, M. Kieffer, ??? Washington University
S. Falke, E. Fialkowski ???
F. Lindsay, S. Kempler,... GIOVANNI Team ??? NASA
KMNL Team, ???ESA
S. Young, R. Scheffe, N. Frank, AirNow Team,??? EPA
Background
The OMI sensor on the AURA platform has opened up a new era of atmospheric composition characterization and monitoring. The sensor provides global daily coverage of columnar concentration of ozone, NO2, and formaldehyde. It also delivers absorbing aerosol index and other parameters that characterize atmospheric composition. The near-real-time delivery of these products are, in effect, described the "chemical weather", in a similar manner as meteorological satellites characterize the physical weather. These products of atmospheric composition are also available for assimilation into chemical models which in turn can improve the chemical forecasts.
The utilization of the OMI data has barely begun. A particularly promising application of the OMI data is for air quality management. The high resolution (25km) spatial coverage and the daily repetition augments the current surface-based monitoring in a substantial way. Though the full application range of the OMI products for air quality applications is not yet fully identified, it is clear, however, that process-oriented intensive field studies, analysis of natural and anthropogenic air pollution events as well as policy development applications can benefit from this extended chemical characterization.
The ability to use the OMI data for air quality applications can be enhanced by information infrastructure that can deliver these data in a timely manner to the users in a convenient ... The key purpose of this pilot project is to establish a data flow and processing environment for the transfer of the OMI data from the providers at NASA and ESA (KNML) and air quality analysts {EPA and elsewhere). This progress report summarizes the activities related to a demonstration at the summer '07 ESIP meeting.
The overall data flow is shown in the schematic diagram prepared by the NASA project officer, Francis Lindsay.
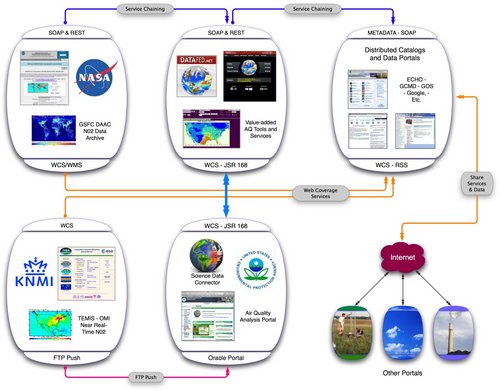 Figure 1. Schematic diagram of the OMI data flow between the providers (NASA, ESA) and users (EPA and on the internet "cloud")
Placeholder paragraph for GIOVANNI Team describing their data mediation
Placeholder paragraph for KMNL Team describing their work on OMI sensor
Placeholder paragraph for NASA Team describing their algorithm
Note to Frank: We could use guidance on how to describe the "front end" of the data flow
OMI Data Flow from Providers to the Data Analysts
The high resolution OMI data are accessed through the OMI page on GIOVANNI data portal. Key feature of the GIOVANNI system is data access through their REST web service interface. The GIOVANNI data query allows the specification of the desired parameter. The return from such a query is a numerical grid, which can then be processed and portrayed in the DataFed system. Over the past year, several satellite datasets accessible through GIOVANNI have been federated through DataFed. The high resolution OMI data are the most recent additions to the federated data pool.
OMI data delivery through DataFed
The gridded OMI data can be explored and processed (filtered, aggregated)through the DataFed system. More description on the processing facilities will follow....
Figure 2. OMI Aerosol Index shown through DataFed Browser
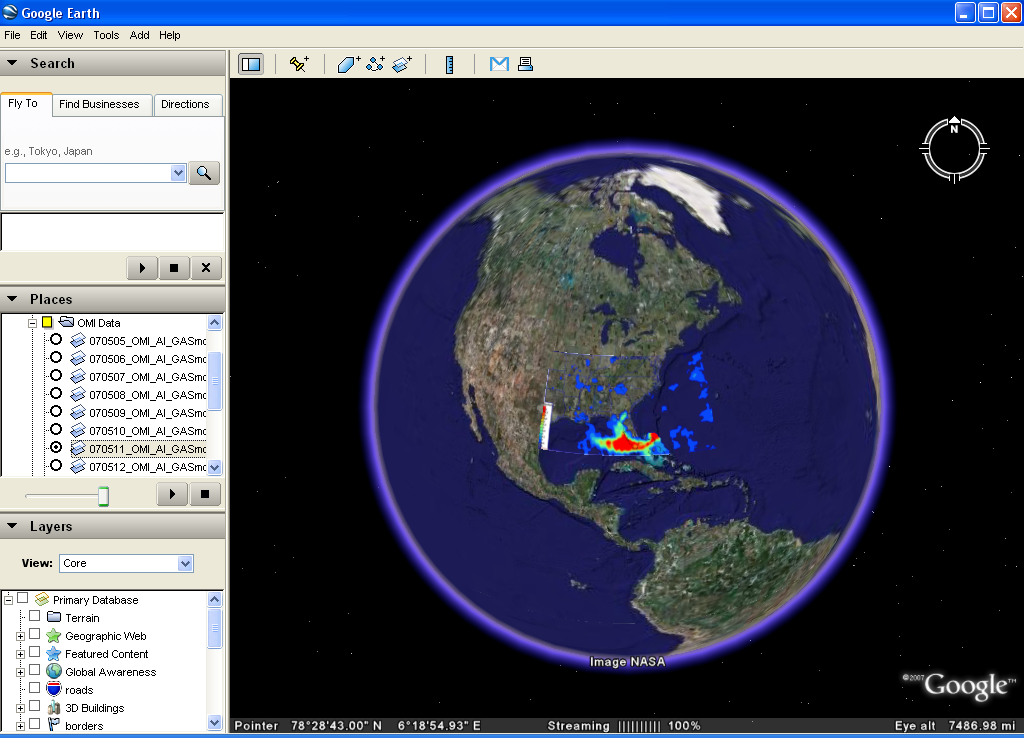
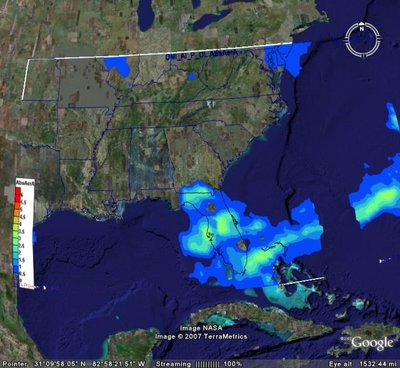
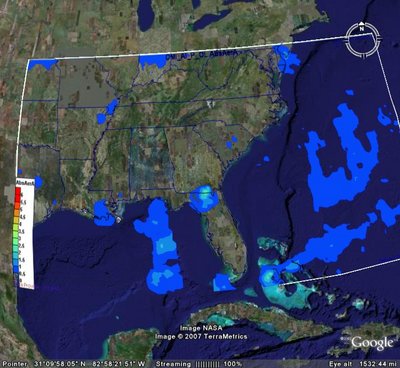
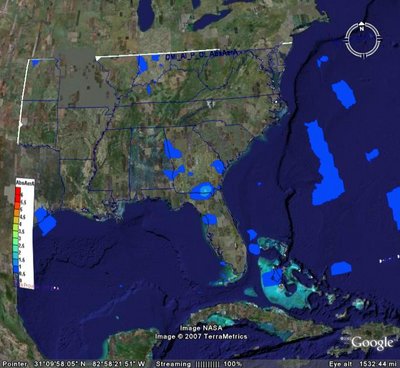
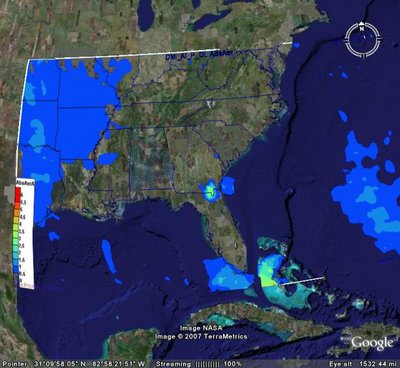
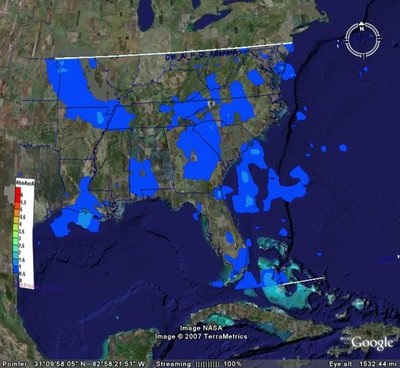
A key feature of the federated system is the open interface through which data can be accessed from DataFed through standard WCS,WMS interface. The convenience of this interface is best demonstrated by the ability to mash-up the DataFed access and processing facility with the Google Earth data viewer. The OGC standard interface to the OMI data in principle opens up the OMI data to any user on the internet. It is expected that this data access path to the OMI data will be registered in NASA registries (Earth Science Gateway), Global Change Master Directory, ECHO. Through these registries even more users can find and bind (access) the OMI data.
Figure 3. OMI data accessed from GIOVANNI, transformed in DataFed, delivered to the user through Google Earth.
More description on Google Earth connection will follow...
Application of OMI data at EPA
Steve Young from the Environmental Information Office ??? at EPA has provided useful general guidance for the preparation of OMI data for EPA use. He proposed a two stream approach:
- A simple "story" that illustrates the use of OMI data within EPA. This packaging would be tailored to administrators, but still convey the key message. A Google Earth interface would be desirable.
- The second stream would be for technical analysts, who would use the data to provide better understanding (science) or technical support to air quality management.
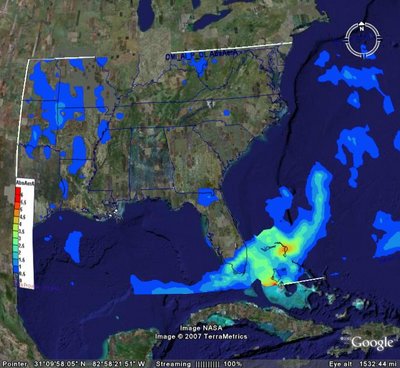
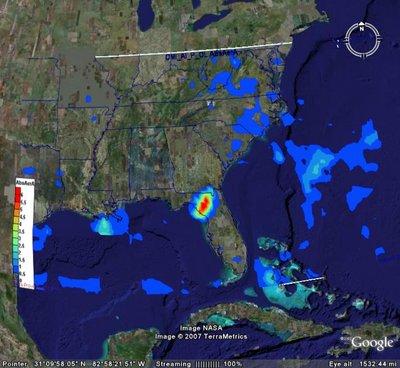
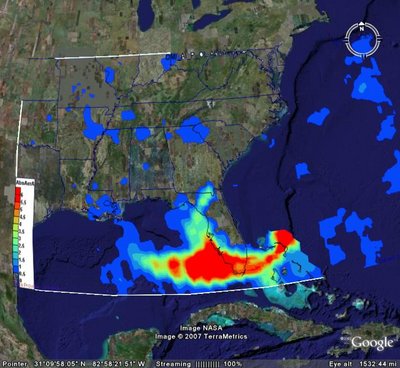
The images below show our initial attempts to the first stream, deliver the data through the Google Earth interface.
Workspace for the 2007-07-22 OMI Demo at Summer 2007 ESIP.
Steve Young:
- Show OMI data for G-rated audience.
- Use GoogleEarth mashup- contact Vladimir Silva regarding cool mashups
- Think of the demo as an extension of the TV weather report, e.g. local radar
- ESIP 07 as a milestone toward EPA GEOSS show in Capetown, South Africa
- On a separate track, explore science application of OMI data
Frank Lindsay:
- Show OMI as a useful product, e.g. Steve Young scenario
- Demonstrate interoperability among distributed participants
- ...
