Difference between revisions of "Data Value Chain Diagram....Draft for your comments"
| Line 8: | Line 8: | ||
===Husar Comment -- [[User:Rhusar|Rhusar]] === | ===Husar Comment -- [[User:Rhusar|Rhusar]] === | ||
| + | Nice work Louis. I also agree that from the point of view of the data system, models are just another form of input data. I also like the explicit depiction of intermediate data generated as part of the processing. | ||
| + | |||
| + | Here's a quick feedback on one particular item: data analysis and visualization is now lumped into one black box. I think of data analysis involving all three iterative steps: (1) choosing the proper datasets, (2) processing through filtering, aggregation and fusion and (3) visualizing. Seperating visualization and analysis into a black box (which involves more processing) reminds me of having a seperate 'visualization laboratory' that contributes the key analysis. | ||
| + | |||
[[Image:DATA VALUE CHAIN rev2R.png|600px]] | [[Image:DATA VALUE CHAIN rev2R.png|600px]] | ||
Revision as of 13:44, February 5, 2008
< Back to Data Summit Workspace
Please provide your comments to louis.sweeny@ross-assoc.com

Scheffe Comment -- rich scheffe (Rscheffe)
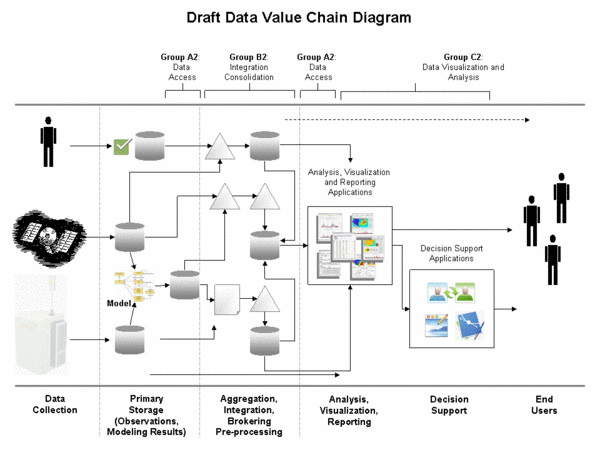
Louis, this is good...I would remove modeling from the B2 integration area...conceptually you are ciorrect...taht is...it takes raw information to drive models...a postprocessing of sorts...but in this community we are treating modeled output as a "eaw" data source comparable to measurements...and, the reality is that the modeling systems have faily specific programs that perform the necessary prepartions of emissions, meterological and air quality data....I would just call just call it aggregation and integration...(processing is often thought of as the more downstrem efforts...) also...need to perhaps shade the area left of decision making to emphasize focus of this meeting....not that imporatnt
Husar Comment -- Rhusar
Nice work Louis. I also agree that from the point of view of the data system, models are just another form of input data. I also like the explicit depiction of intermediate data generated as part of the processing.
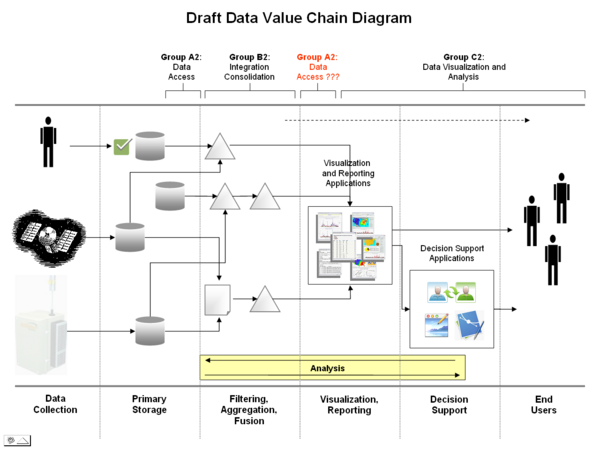
Here's a quick feedback on one particular item: data analysis and visualization is now lumped into one black box. I think of data analysis involving all three iterative steps: (1) choosing the proper datasets, (2) processing through filtering, aggregation and fusion and (3) visualizing. Seperating visualization and analysis into a black box (which involves more processing) reminds me of having a seperate 'visualization laboratory' that contributes the key analysis.
