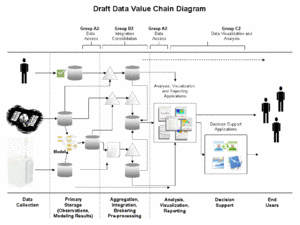
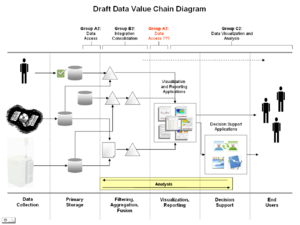
Data Value Chain Diagram....Draft for your comments
< Back to Data Summit Workspace
Sweeny Diagram
Please provide your comments to louis.sweeny@ross-assoc.com
Scheffe Comment -- rich scheffe (Rscheffe)
Louis, this is good...I would remove modeling from the B2 integration area...conceptually you are ciorrect...taht is...it takes raw information to drive models...a postprocessing of sorts...but in this community we are treating modeled output as a "eaw" data source comparable to measurements...and, the reality is that the modeling systems have faily specific programs that perform the necessary prepartions of emissions, meterological and air quality data....I would just call just call it aggregation and integration...(processing is often thought of as the more downstrem efforts...) also...need to perhaps shade the area left of decision making to emphasize focus of this meeting....not that imporatnt
Husar Comment -- Rhusar
Nice work Louis. I also agree that from the point of view of the data system, models are just another form of input data. I also like the explicit depiction of intermediate data generated as part of the processing.
Here's a quick feedback on one particular item: data analysis and visualization is now lumped into one black box. I think of data analysis involving all three iterative steps: (1) choosing the proper datasets, (2) processing through filtering, aggregation and fusion and (3) visualizing. Seperating visualization and analysis into a black box (which involves more processing) reminds me of having a seperate 'visualization laboratory' that contributes the key analysis. As indicated in this diagram, analysis is a compound process that spans all the steps in this value chain. More ideas on this are collected on the wiki page.
Another approach is to use Rich Scheffe's Characterization concept in which multi-sensory data are integrated, possibly including the model results, and the air is 'characterized' through such integration and fusion process. The product of that step is reusable knowledge about air quality, which is applicable to any decision-support process.
Lets think more about that...
Questions to be resolved:
- How do we represent intermediate, processed data in the value chain? Making them explicit steps in the sequence or just feeding the processed data back into the data pool at the front of the chain?
- How do we incorporate the GEOSS concepts:
- All data as service accessible through standard interfaces
- Registering all access, processing and visualization services as reusable components
- Service Oriented Architecture, using workflow to integrate the service components
In other words, are we ready to pursue the new loosely coupled architecture, at least as an alternative to the tightly coupled current stove pipes?

