Difference between revisions of "Infographics"
From Earth Science Information Partners (ESIP)
| Line 2: | Line 2: | ||
Turning data into images is one step in a larger process of turning data into stories. Infographics relate data to commonly known arenas of knowledge so that the impact of the data can be widely understood. What are the ways that Earth data can inform infographic designs that engage the public, and that will be widely shared across social media sites? | Turning data into images is one step in a larger process of turning data into stories. Infographics relate data to commonly known arenas of knowledge so that the impact of the data can be widely understood. What are the ways that Earth data can inform infographic designs that engage the public, and that will be widely shared across social media sites? | ||
| + | |||
| + | ==Infographics & Data Visualization== | ||
| + | What is an infographic and how to make one: | ||
| + | |||
| + | *[http://mashable.com/2012/07/09/how-to-create-an-infographic/ How to Create an Awesome Infographic] | ||
| + | |||
| + | An online list of data visualization tools compiled by Interactive Things: | ||
| + | |||
| + | *[http://datavisualization.ch/tools/selected-tools/ selection.datavisualization.ch] | ||
| + | |||
| + | Two simple to use mapping tools developed by NASA: | ||
| + | |||
| + | *[http://www.giss.nasa.gov/tools/panoply/ Panoply] | ||
| + | *[http://www.giss.nasa.gov/tools/gprojector/ G.Projector] | ||
| + | |||
| + | A visualization framework developed by Periscopic: | ||
| + | |||
| + | *[http://www.stateofthesalmon.org/iucn/new/ State of the Salmon] | ||
| + | |||
| + | Examples of infographics: | ||
| + | |||
| + | *[http://big.assets.huffingtonpost.com/A_Lonely_Planet_2_0.png A Lonely Planet] | ||
| + | *[http://xkcd.com/1071/ Planets to Scale] | ||
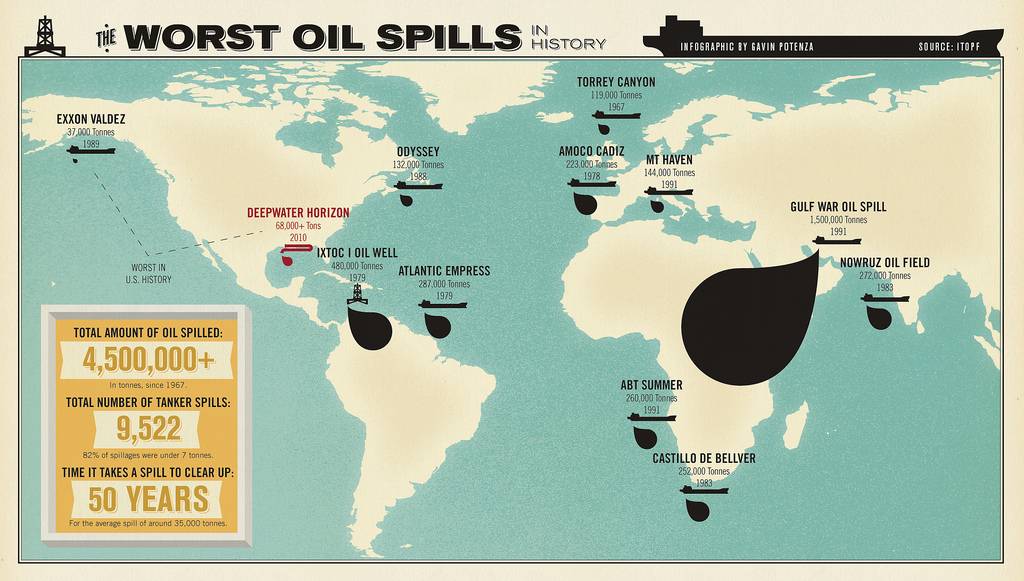
| + | *[http://blog.blueion.com/wp-content/uploads/2010/05/Infographic-The-Worst-Oil-Spills-In-History1.jpg Worst Oil Spills in History] | ||
| + | *[http://theseamonster.net/2012/07/oceans-of-garbage/ The SeaMonster] | ||
Revision as of 17:57, August 2, 2012
Infographic Resources, Work Flows, and Designs for Earth Science
Turning data into images is one step in a larger process of turning data into stories. Infographics relate data to commonly known arenas of knowledge so that the impact of the data can be widely understood. What are the ways that Earth data can inform infographic designs that engage the public, and that will be widely shared across social media sites?
Infographics & Data Visualization
What is an infographic and how to make one:
An online list of data visualization tools compiled by Interactive Things:
Two simple to use mapping tools developed by NASA:
A visualization framework developed by Periscopic:
Examples of infographics: