Difference between revisions of "Earth Science Data Analytics/2014-05-22 Telecon"
| Line 51: | Line 51: | ||
| − | Tiffany next | + | Tiffany next continued discussion to answer the following questions:<br /> |
1. What are your most time consuming data tasks that can leverage analytics?<br /> | 1. What are your most time consuming data tasks that can leverage analytics?<br /> | ||
| Line 59: | Line 59: | ||
| − | + | Discussion focused on the different types of data analytics:<br /> | |
| − | |||
| − | |||
| − | Discussion | ||
[[Image:onemoretype.png|500px]] | [[Image:onemoretype.png|500px]] | ||
| − | + | In particular, question 3, regarding use cases, and question 4, regarding tools and technologies, led to a 'tour', by Steve, through the ESDA information gathering pages. Namely:<br /> | |
| − | |||
| − | |||
| − | |||
| − | |||
| − | |||
| − | |||
| − | |||
| − | + | Use Case Collection webpage - http://wiki.esipfed.org/index.php/Use_Case_Collection | |
| − | + | Data Analytics Tools/Techniques Collection webpage - http://wiki.esipfed.org/index.php/Analytics_Tools | |
| − | |||
| − | - | ||
| − | |||
| − | |||
| − | |||
| − | |||
| − | |||
| − | |||
Revision as of 09:48, May 23, 2014
SDA Telecom notes – 5/22/14
Known Attendees:
To be Provided
Agenda:
1 – Steve Kempler - Recap of last telecon
2 – Tiffany Matthews – Describe/Demonstrate UV CDAT and ClimatePipes visualization analytics tools
UV CAT: http://uv-cdat.llnl.gov/
3 – Tiffany - To lead discussion started last week: 'enabling users to leverage data to observe more phenomena than what can be identified when studying an average'.
Tiffany will continue discussion with her presentation entitled: " Atmospheric Science Data Center Sample Data Analytics Use Cases."
4 – Steve - Present new Cluster Information Sharing Websites
Earth Science Data Analytics Discussion Forum - http://wiki.esipfed.org/index.php/Earth_Science_Data_Analytics/Discussion_Forum
Use Case Collection webpage - http://wiki.esipfed.org/index.php/Use_Case_Collection
Data Analytics Tools/Techniques Collection webpage - http://wiki.esipfed.org/index.php/Analytics_Tools
Presentations:
Notes:
Today, Tiffany provided a demonstration of UV CVAT, and described ClimatyePipes, two visualization analytics tools. Tiffany followed with a continuation of last month's discussion on different types of data analytics. Steve followed, showing the ESDA Use Case Gathering website, and Data Analytics Tools/Techniques Inventory website.
From Tiffany's UV CVAT and ClimatePipes demonstration/discussion
UV-CDAT http://uv-cdat.llnl.gov/ Description: UV-CDAT brings together two active projects -- Ultrascale Visualization Climate Data Analysis Tools and Visual Data Exploration and Analysis of Ultra-large Climate Data, with the intent to deliver new capabilities to the climate-science community. This project’s vision is to provide large-scale visualization and analysis for both observational and model-generated climate data, with the goal of delivering new capabilities into the hands of the climate scientists. The integrated software product, the Ultrascale Visualization Climate Data Analysis Tools (UV-CDAT), is intended to be a powerful and complete front-end to a rich set of visual-data exploration and analysis capabilities well suited for climate-data analysis problems. UV-CDAT builds on the following key technologies: the Climate Data Analysis Tools (CDAT) framework; ParaView; VisTrails; and VisIt.
Additional Info: The NCCS at GSFC is developing climate data analysis and viasualization tools for UV-CDAT, that provide data analysis capabilities for the Earth System Grid (ESG). These tools feature workflow interfaces, interactive 3D data exploration, hyper wall and stereo visualization, automated provenance generation, parallel task execution, and streaming data parallel pipelines. NASA’s DV3D is a UV-CDAT package that enables exploratory analysis of diverse and rich data sets from various sources including the Earth System Grid Federation (ESGF). Additionally, Python scripts can easily be generated.
ClimatePipes Description: ClimatePipes is a web-based application platform/"IDE" for science data analysis. It can be used to create and run analysis workflows and visualizations. Additional Info:The front-end uses HTML5, WebGL, and CSS3 for geospatial visualizations. The back-end is built using the Visualization Toolkit (VTK), Climate Data Analysis Tools (CDAT), and other climate and geospatial data processing tools such as GDAL and PROJ4. ParaView Web, and D3, Canvas are also used for some visualizations, offers look-up tools, works with UVC-DAT and MongoDB. It can read NetCDF, offers a python Web Service infrastructure, supports workflows and provenance tools using VisTrails. Python was chosen as theserver-side language using CherryPy (http://www.cherrypy.org/) as the web server. JQuery (http://jquery.com/) and Bootstrap are being used as the supporting frameworksfor a consistent interactive cross-browser experience.
Tiffany next continued discussion to answer the following questions:
1. What are your most time consuming data tasks that can leverage analytics?
2. Identify and discuss different types of analytics
3. What kind of data analytics is needed for specific use cases?
4. Identify tools and technologies that address different types of analytics
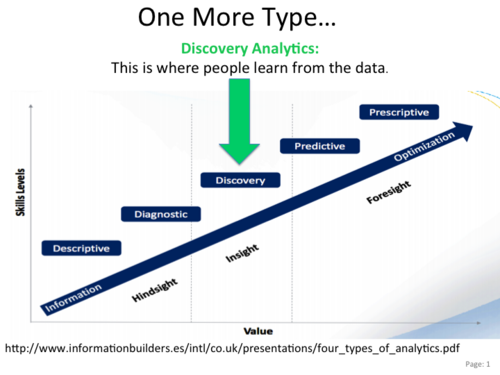
Discussion focused on the different types of data analytics:

In particular, question 3, regarding use cases, and question 4, regarding tools and technologies, led to a 'tour', by Steve, through the ESDA information gathering pages. Namely:
Use Case Collection webpage - http://wiki.esipfed.org/index.php/Use_Case_Collection
Data Analytics Tools/Techniques Collection webpage - http://wiki.esipfed.org/index.php/Analytics_Tools
Next Telecon:
- June 26, 3:00 EST
- Agenda (as of now)
- Listen and Learn - We will have 2 guest speakers to discuss their Analytics activities
- ESDA Activities - Use Case Collection webpage - http://wiki.esipfed.org/index.php/Use_Case_Collection
- Preparation for Frisco