EE CompliancePatternTrend
From Earth Science Information Partners (ESIP)
The printable version is no longer supported and may have rendering errors. Please update your browser bookmarks and please use the default browser print function instead.
< Back to Exceptional Event Workspace
Required Evidence for Flagging Exceptional Events
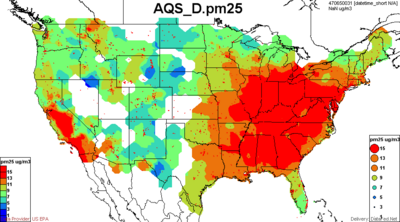
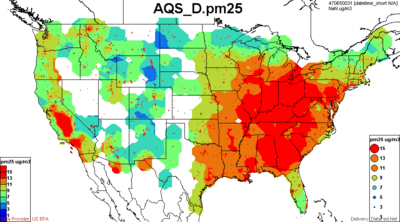
PM2.5 Concentration Trend 2000-2006
Three-year aggregates of PM2.5. Left Images: Annual average PM10: Right Images: 98th Percentile.
Note the remarkable decline of both PM2.5 matric in the period 2000-2006
1999-2001
2000-2002
2001-2003
2002-2004
2003-2005
2004-2006
2005-2007


