Difference between revisions of "EE CompliancePatternTrend"
From Earth Science Information Partners (ESIP)
| Line 49: | Line 49: | ||
<p> | <p> | ||
</html> | </html> | ||
| + | |||
| + | |||
| + | [[Image:2000_04_FRMPM25_Avg.png|400px]] [[Image:2005_08_FRMPM25_Avg.png|400px]] | ||
Latest revision as of 16:55, July 11, 2008
< Back to Exceptional Event Workspace
Required Evidence for Flagging Exceptional Events
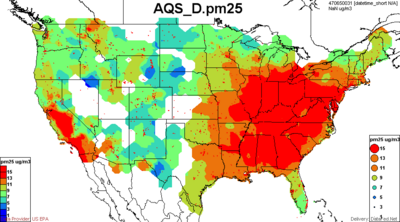
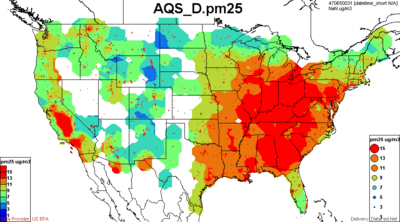
PM2.5 Concentration Trend 2000-2006
Three-year aggregates of PM2.5. Left Images: Annual average PM10: Right Images: 98th Percentile.
Note the remarkable decline of both PM2.5 matric in the period 2000-2006
1999-2001
2000-2002
2001-2003
2002-2004
2003-2005
2004-2006
2005-2007


