EE Tools and Methods
From Earth Science Information Partners (ESIP)
< Exceptional Air Pollution Event Analysis Community Workspace | Discussion | News | Participants | About
Tools and Methods for Exceptional Event Analysis
General Tools and Methods
R. Husar, WUStL
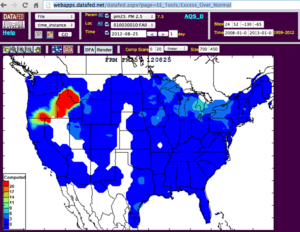
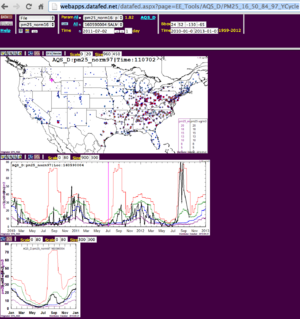
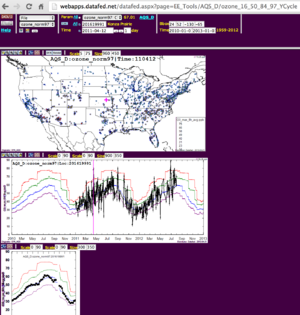
EE Excess Over Normal Variations
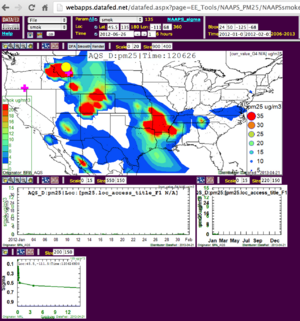
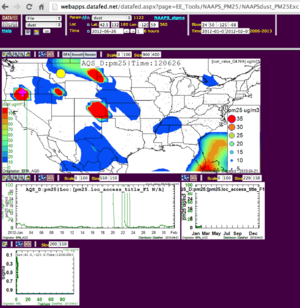
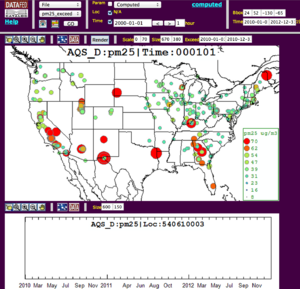 PM25Ex, PM25_Ex_ONorm: Flag_Smoke, Flag_Dust, Flag_None
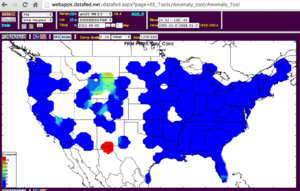
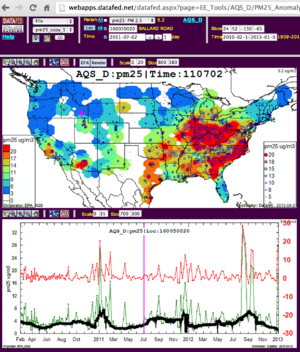 PM25 Anomaly TimeSeries over 30perc
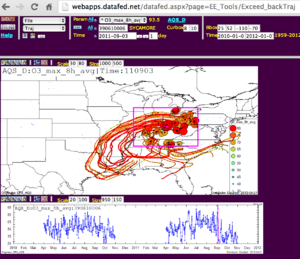
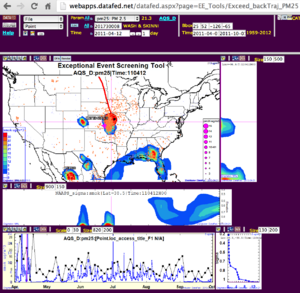
EE Backtrajectory Tools
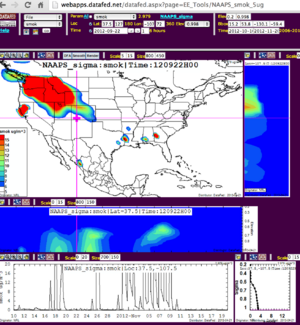
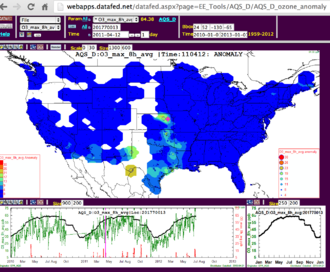
EE Consoles
- Browser
- uFIND
- Console
- Wash.U. DataFed: AQ Events, Data, Tools,
STI
- Airnow Tech: http://www.airnowtech.org/index.cfm
- BlueSky: http://www.airfire.org/bluesky/
T. Moore, WRAP
- WRAP Fire Emissions Tracking System (FETS) http://www.wrapfets.org/ - basis of the 2 Joint Fire Sciences Program projects we are working on, which are:
- DEASCO3 http://www.wrapfets.org/deasco3.cfm - started Winter 2011-12 and completes June 2013, and
- PMDETAIL http://www.wrapfets.org/pmdetail.cfm - started Winter 2012-13 and to complete Spring 2016
- Monitoring Trends in Burn Severity
- Hazard Mapping System
Statistical Ozone Forecast Methods
D. Jaffe, U. Washington
P. Reddy, Colorado Department of Public Health and Environment Air Pollution Control Division
H. Hafner, STI
H. Priesler, Forest Service
- A Statistical Model for Forecasting Hourly Ozone Levels During Fire Season
- Spatially explicit forecasts of large wildland fire probability and suppression costs for California
Event Detection Tools and Methods
Preisler, Climate Applications Laboratory University of California Merced
Wildfire Forecast Probabilities and Odds- Preisler and Westerling (2007) and Preisler et al (2011) proposed a seasonal forecast methodology for fire occurrence, extent, and suppression costs for California.
