Statistics on Interoperability Papers at Fall AGU Meetings
To edit or discuss this page, it is preferred that you log in.
Edit pages by clicking the edit tab. Practice editing in the Sandbox.
Discussion for this page
Purpose and Procedure
In preparation for the AGU session: "Standards-Based Interoperability Among Tools and Data Services in the Earth Sciences" (Oral Session,Poster) we (the session chairs) begun a crude empirical content analysis of the AGU abstracts. The purpose of this note is to empirically explore the current state of interoperability in Earth Science information systems - as reflected in presentations at the recent (2003-2006) American Geophysical Union (AGU) meetings. Through this interactive wiki page, we cordially invite others to share their ideas, observations and analyses.
Procedure: The procedure for developing the statistics involve accessing the AGU Abstracts Database for the fall meetings of 2002, 2003, 2004, 2005, and 2006. The search was conducted using keywords that occurred in any of the abstract's fields including title, body, and keywords. Otherwise, the search was not confined, in other words the resulting list of abstracts was selected from the entire database for that year. The list of 21 analyzed abstracts mostly (18/21) includes contributions from the Earth Science Informatics domain. As seen below the classification of the contents is rather arbitrary and the overall analysis is exploratory.
Interoperability: Wikipedia defines Interoperability as the ability of products, systems, or business processes to work together to accomplish a common task. According to ISO/IEC 2382-01, it is the "The capability to communicate, execute programs, or transfer data among various functional units in a manner that requires the user to have little or no knowledge of the unique characteristics of those units". [1]
Context and Content of "Interoperability"
Searching for interoperability for the fall 2006 yielded thirty abstracts. Visual inspection of each abstract was performed to examine the context in which the interoperability was used. The pie chart below shows the number of abstracts for each context.
Of the thirty abstracts with interoperability, seven abstracts were classified as General since the context referred to general aspects of information interoperability. In three abstracts interoperability was used in the context of physical homogenization and integration of heterogeneous data. Another three abstracts dealt with the semantic aspect of interoperability, i.e. linking the meanings of different datasets. The largest group of seventeen abstracts incorporated interoperability with specific reference to applications using the suite of OGC Standards.
It is evident that Earth Science interoperabilityis closely linked to the suite of OGC Standards. (Note: I think that I was some what biased toward OGC at the expense of semantic interoperability)
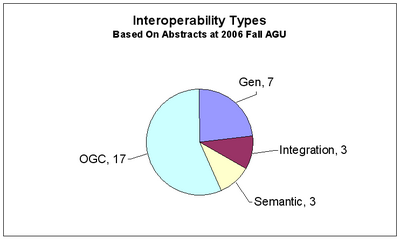
Plot comes from: Interoperability Trends Spreadsheet
Application Areas and Target Users
Half of the abstracts (11/21) pertain to application areas in Earth Science in general. While the other half is devoted to application that are targeted to either Earth Science sub domains (e.g. hydrology, ozone) or geographic (e.g. Antartica).
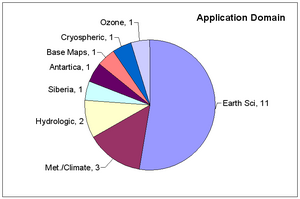
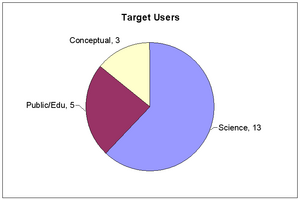
Plots come from: Interoperability Abstract Analysis Spreadsheet
The target users for the information systems were mostly for scientists (13/21). There are also significant efforts (5/21) devoted to public/educational users. Three papers on interoperability were "conceptual",e.g. data models, which makes them hard to classify.
Data Services
Data access services using WMS and WCS services are addressed in 17 of the abstracts. Eight abstracts indicated the use of WMS, three indicated the use of WCS Standards and six referred to both WMS and WCS.
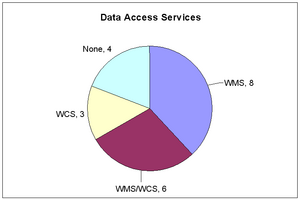
Plots come from: Interoperability Abstract Analysis Spreadsheet
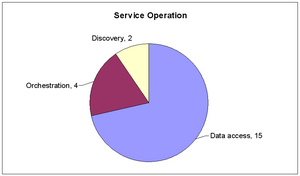
The data service operations were mostly data access services (15) and data discovery services (2). Four contributions are devoted to data processing and orchestration of service chains. Nine abstracts containing interoperability include end user tools such as data browsers, the rest did not.
Trends in use of Interoperability
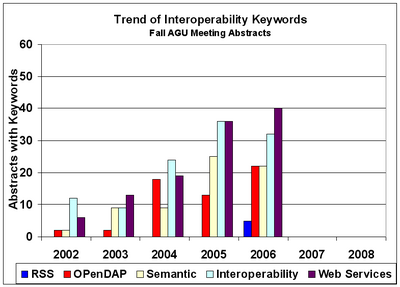
It is interesting to examine the four year (2002-2006) trend of interoperability use in AGU abstracts. The procedure was to count the number of abstracts for search terms: Interoperability, OGC, WMS, etc.
OPenDAP, one of the early interoperability protocols has been increasing from 2 in 2002 to 15-20 abstracts. The number of abstracts with the terms interoperability and web services increased from 10-15 in 2002 to 35-40 in 2006. In 2006 we also see the emergence (5 abstracts) of the Really Simple Syndication (RSS) communications protocol for 'pushing' data from the providers to the users. The word semantic (interoperability?) occurred only twice in 2002, but it appears in 22-25 by 2005-2006.
Plots come from: Interoperability Trends Spreadsheet
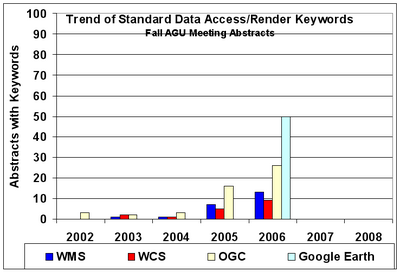
The frequency of abstracts with the terms OGC, WCS, and WMS have increased more dramatically. OGC increased from 2 to 25 while WMS and WCS increased rose from 2 to about 10 abstracts. A truly spectacular trend is seen for the use of Google Earth. In 2006, within a year of its appearance, there were fifty (50)! AGU abstracts referring to the use of Google Earth. For reference, the total number of Fall AGU abstracts grew at a much slower(about 10%) rate per year from 11574 in 2004 to 14,146 in 2006.
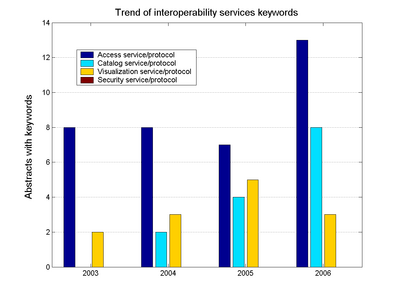
More generally, it is possible to analyze the keywords trend for main types of interoperability services: access services, catalogue/discovery/registry services, visualization/presentation services.
The diagram shows that interoperability was first pursued implementing data access services, then, providing catalog and registry services. The recent popularity of Google Earth doesn’t seem to have pushed references to visualization services. A possible interpretation is that Google Earth seems to be used more as a presentation tool, rather than as an interoperable visualization protocol. Eventually, security services don’t seem to be considered very important, up to now. We expect they will become, very soon.
Trends in use of standards-based solutions
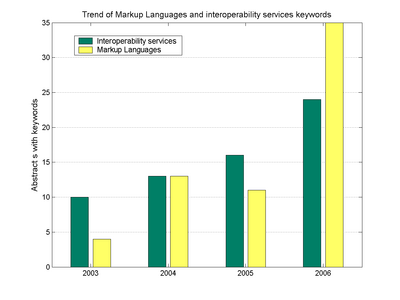
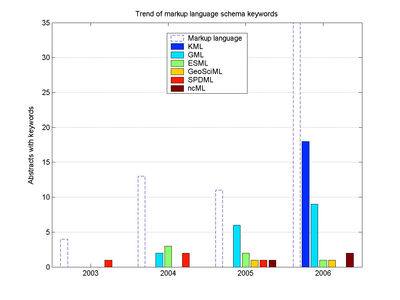
It is interesting to examine trends of public available specifications which aim to become de-facto standard. This is true for both Markup Languages and data services.
Referring to the diagram, we can outline: the steady positive trend of OGC/ISO GML (and related application schemas), the sudden explosion of Google KML and the existence of more specific MLs which are trying to become de-facto standards for Earth Sciences. Indeed, the more referenced (used?) MLs are related to popular interoperability environments or tools, such as: OGC Web Services and Google Earth.
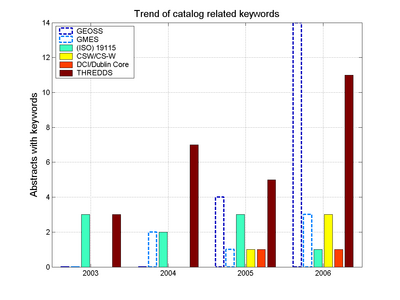
Data access services were already analyzed, interoperable visualization service standards don't seem to be very popular; thus, we focussed on the trend of keywords for catalog service standards.
Referring to the diagram, it’s noticeable the constant presence of the ISO 19115 keyword, while Dublin Core Initiative and OGC CS-W are referenced in the most recent abstracts. UNIDATA THREDDS seems to be popular; in fact, THREDDS may be coupled with OPeNDAP and implemented a WCS interface, more recently. The diagram reports the positive trends of the references to a couple of international initiatives which should stimulate the implementation of catalog services: GEOSS and GMES.
Discussion Items on Interoperability Analysis
The discussion is pursued on the discussion page and includes these initial statements and comments. It is hoped that the above provocative statements will promote constructive community discussion.
