Mitigating the anticipated impacts of increased nutrient runoff from flashy precipitation from poultry agriculture in the Chesapeake watershed.
Agriculture resilience scenario used to drive the concept map development
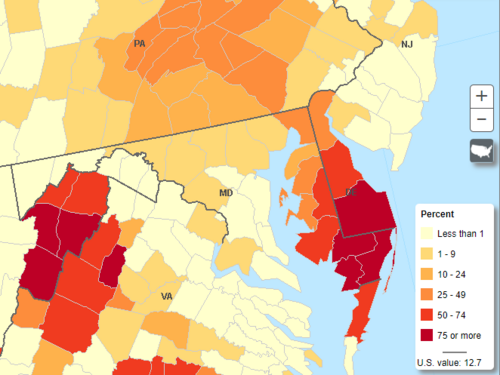
To anchor the "decision" end of the "data to decisions" pipeline, we shall focus on a use-case centered on climate adaptation challenges in the Chesapeake watershed. In particular, we focus on poultry agriculture in the Delmarva Peninsula (derived from the names of the States of Delaware, Maryland, and Virginia). The figure below shows USDA agriculture census data representing the value of poultry and eggs sold as a percentage of the total market value of agricultural products in 2017.
The hypothetical use-case involves an inter-county task force ("task force") charged with drafting a regional resilience plan to ameliorate the impacts of climate change on the economy and biodiversity of the Chesapeake watershed. First, the task force convened a multitude of stakeholders to derive a common understanding of the risks and vulnerabilities. Stakeholders included business owners, farmers, critical infrastructure operators, economic planners, scientists, environmental engineers, and government representatives. A shared understanding of the challenges facing the region was captured in a number of concept maps. These concept maps proved to be effective as visual communication tools to share the stakeholders' common understanding of the challenges confronting their communities.
Subsequently, the task force charged a team of transdisciplinary ESIP folks (yay!!!!) to develop a technology plan to support science-informed, data-driven decision-making. The ESIP folks were asked to first focus on meeting the needs of the poultry agriculture industry. However, the technology plan should also be scalable to meet the needs of other areas of concern like enhancing coastal flood abatement civil infrastructure, enhancing the long-term sustainability of Chesapeake oyster farms, etc.

(Image source: https://www.nass.usda.gov/Publications/AgCensus/2017/Online_Resources/Ag_Census_Web_Maps/, retrieved 2020-03-28 1615 hrs GMT.)
Starting from decisions and tracing back to data and technology
Click only on the orange-colored nodes as you navigate the c-soup. Strung sequentially together, these orange colored nodes constitute a pathway that brings the user through the science and technology landscape that crosses paths with decision-makers, informatics professionals, and domain scientists. Below is a high-level sequence of concepts (i.e. sequenced order of triples that capture the provenance of a decision) that was constructed using nodes in c-soup. Each node in the c-soup should ideally have its own Internationalized Resource Identifier (IRI) so that individual nodes from different concept maps can be chained to represent some process. This is NOT the case with the current prototype experimental implementation shown here.
The orange colored nodes below are clickable, but you would be left scrolling around madly within the restricted size window. Click here instead to render the full-scale concept map below in your browser window.
The high-level sequence of concepts above is an instantiated version of the diagram posted above (with apologies for the contra-directional flow):
![]()
The concept map below corresponds to the first orange node above. Selected nodes (equivalent terms: subject, object) and relations (equivalent term: predicate) contain a semantic annotation by way of a URL that resolves to OBO Foundry ontologies like ENVO (Environment Ontology), AGRO (Agronomy Ontology), SDGIO (Sustainable Development Goals Interface Ontology), and RO (Relations Ontology). There is admittedly not much consistency in which nodes and relations get labeled, because this is a phase of active experimentation.
Click here to render the full-scale concept map below in your browser window.