Help:Using the Concentration Anomaly Tool
Back to <Evidence for Flagging Exceptional Events
Link to Concentration Anomaly Tool
A useful measure of the "normal" concentration is the 84th percentile (+1 sigma) for a given station. A concentration anomaly is a deviation from the normal. This tool permits the calculation of concentration anomalies. In the illustration below, a time windows of +/- 15 days (one month window) was chosen. This period is longer than a typical exceptional event, but it is sufficiently short to preserve seasonality. In order to establish the normal values the concentrations can be averaged over multiple years for the given time window measured in Julian days, i.e. days between 160 and 190. Hence, a particular sample is considered anomolously high (deviates from the normal) if its value are substantially higher than the 84th percentile of the multi-year measurements for that "month" of the year.
The time parameters of the Concentration Anomaly Tool can be adjusted, changing: (1) the event day, (2) time window and (3) the time range that the time window is averaged over.
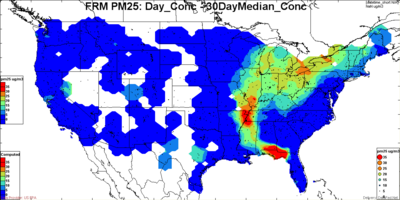
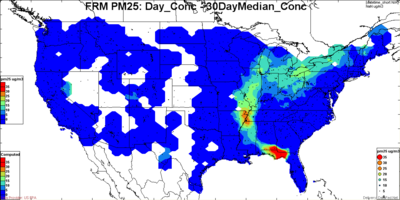
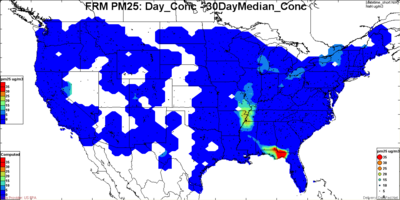
There is also need for flexibility in defining the 'normal' when calculating the deviation above normal. For example in figures below, the excess concentration is plotted based on 'normal' defined as the 50th, 84th (+ sigma) and 95th percentile of the distribution. Clearly, on a given day, the excess above the 95th percentile is much smaller than excess above the 50th percentile.
The anomaly calculation parameters of the Concentration Anomaly Tool can also be adjusted, changing: (1) the percentile that is defined as "normal" and (2) the calculation to find the difference from normal.
The tool has three layers that can be viewed and changed: Time Instance, Time Range and computed.
Time Parameters
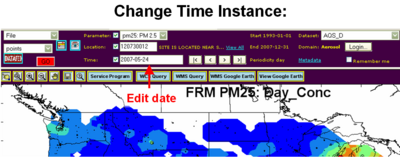
Change the event day
- Select Time Instance Layer and change the date in the Viewer, click go.
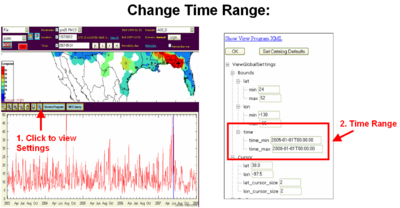
Change the Time Range
- In the time view, click the magnify glass
- Change time_min and time_max. Click Ok and then in the viewer click the red "Go" Button. The Time view will refresh with the new range.
- Note: This changes the window that the anomaly calculation uses to average over.
- Note: Time Range can exclude the event year.
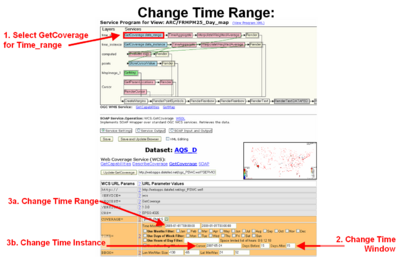
Change the Time Window
- Click Map Service Program
- Select GetCoverage data_range
- In the Time box, change Julian Day Window - days before/days after.
- Save and update browser.
Anomaly Calculation Parameters
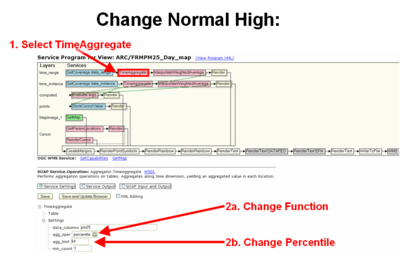
Change the "Normal" High
- Click Map Service Program
- Click Time Aggregate for the Time Range layer.
- To change the function click drop down box that says 'Percentile' and select desired function (e.g. Median, Avg, Sum)
- To change percentile edit the text box below.
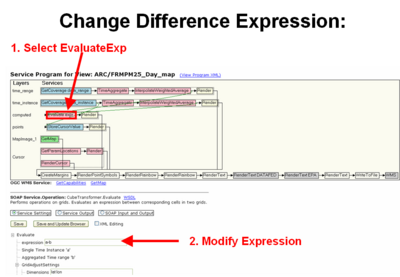
Change the Anomaly Calculation
- Click Map Service Program
- Click Evaluate Exp on the Computed Layer and modify the expression

