Earth Science Data Analytics/2014-04-17 Telecon
ESDA Telecom notes – 4/17/14
Known Attendees:
Erin (ESIP Host), Steve Kempler, Brand Niemann, Seung Hee Kim, Robert Downs, Josh Young, chung-lin shie, Ken Keiser, Rudy Husar, fritz vanwijngaarden, Eric Kihn, John, Tiffany Mathews, suhung shen, Rahul Ramachandran, Walt Baskin, Joan Aron
Agenda:
1 – Present new Cluster Information Sharing Webasites -Steve
Introduction to the Earth Science Data Analytics Discussion Forum - http://wiki.esipfed.org/index.php/Earth_Science_Data_Analytics/Discussion_Forum
Introduction to the Use Case Collection webpage - http://wiki.esipfed.org/index.php/Use_Case_Collection
2 – Joan Aron – To Present: Data Analytics Needs Scenario
3 – Rudy Husar – To present: User-Oriented Data Analytics and Tools in DataFed
4 – Tiffany Matthews – To lead discussion:
'enabling users to leverage data to observe more phenomena than what can be identified when studying an average'.
Tiffany will initiate discussion with her presentation entitled: " Atmospheric Science Data Center Sample Data Analytics Use Cases."
Presentations:
- Joan Aron: Data Analytics Needs Scenario - 4/17/14
- Rudy Husar: User-Oriented Data Analytics and Tools using the Federated Data System DataFed - 4/17/14
- Tiffany Mathews: Atmospheric Science Data Center Sample Analytics Use Cases - 4/17/14
Notes:
Today, from Joan, Rudy, and Tiffany, we received three excellent, insightful presentations regarding the need of data analytics from a user perspective, and a data discovery perspective, as well as useful tools that can help the data user. Please give them a look via the links above.
The ESDA Discussion Forum is open for topic requests, ideas, references, and continued telecom discussion -
http://wiki.esipfed.org/index.php/Earth_Science_Data_Analytics/Discussion_Forum
Highlights from Joan's presentation:
- Provides an end user perspective for data analytics tools/technique needs: Risk Analysis, trends of Near Real Time data
- Need for linking continuous data from various sources
- Use case: Linking Climate and Ar Quality
Highlights from Rudy's presentation:
- Also, provides an end user perspective for Air Quality Decision Systems needed analytics
- DataFed provides a shared data pool (multiple sources), data browser, event screening, data and trend analysis
Highlights from Tiffany's presentation
- From the data provider point of view, provides this excellent perspective: "enable users to leverage data to observe more phenomena than what can be identified by studying an average
- Discussed dataset inter-calibrarions, inter-comparisons, finding data that is meaningful, and being able to analyze original source data associated with higher level data of interest.
Tiffany next led a discussion to answer the following questions:
1. What are your most time consuming data tasks that can leverage analytics?
2. Identify and discuss different types of analytics
3. What kind of data analytics is needed for specific use cases?
4. Identify tools and technologies that address different types of analytics
(Of course,) We did not get through all questions, but after a very good discussion, we decided to post the questions on the 'ESDA discussion Forum' (http://wiki.esipfed.org/index.php/Earth_Science_Data_Analytics/Discussion_Forum) and continue discussion on the forum (I encourage all to participate with questions, answers, and experience)
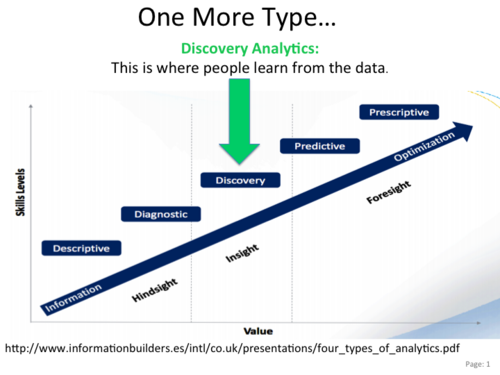
Discussion highlights (thus far), focusing on the different types of data analytics:

- Getting data, in particular, meaningful data is very time consuming
- Metadata is very useful in accessing and understanding data to determine its meaningfulness
- Using semantics to acquire information in metadata needs to be further pursued
- Making data usable in system (i.e., analytics tool, decision support, etc.) is time consuming; Automating process is sometimes difficult
- Types of analytics needed: Provider - Analytics to make data more usable
- Types of analytics needed: Provider/User - For data integration; Combine data from 2 or more data sources; what isn the best way to do this (<-- end goal dependent)
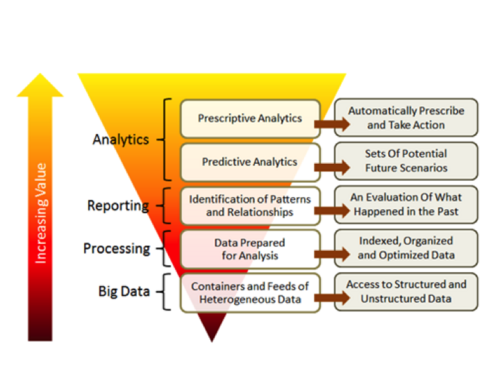
- This is the figure (I believe) Rudy was alluding to, when referring to Big Data Value Chain:
- Using analytics to combine data tools, and be able to reverse out of analytics to get back to the original data
- Tools: Needed for identifying new information from a combination of existing data
- Tools: For linking data to causes (thus working backwards: result --> cause --> data)
- Tools: Data fusion - for example, for environmental data analysis
- But…who should apply data analytics?
Producers (e.g., science teams), the data experts; Providers (e.g., data centers), who know how to build infrastructure/framework to support advancing data analysis; Users (e.g., researchers, decision support), who know exactly what their goals are
- An answer: All… but the key, is to make sure knowledge, experience, and needs, are shared amongst all the groupings.
Discussion continued on Discussion Forum: http://wiki.esipfed.org/index.php/Earth_Science_Data_Analytics/Discussion_Forum
Next Telecon:
- May 22, 3:00 EST
- Agenda (as of now)
- Listen and Learn - We will have 2 guest speakers to discuss their Analytics activities
- Continued discussion from last telecom: Types of Analytics, and Tools/Techniques best suited for each type
- ESDA Activities - Use Case Collection webpage - http://wiki.esipfed.org/index.php/Use_Case_Collection
