GEO User Requirements for Air Quality Report
< GEO User Requirements for Air Quality | Report | Documents | Resources
*** Report is now being modified in Word Doc ***
1. Introduction
This report articulates Earth observation priorities for the Human Health: Air Quality SBA based on an analysis of 60 publicly-available documents, including documents produced by Group on Earth Observations (GEO) member countries and participating organizations.
1.1 GEO and Societal Benefit Areas
The Group on Earth Observations (GEO, www.earthobservations.org) is an intergovernmental organization working to improve the availability, access, and use of Earth observations to benefit society. GEO is coordinating efforts to build a Global Earth Observation System of Systems (GEOSS). GEOSS builds on national, regional, and international observation systems to provide coordinated Earth observations from thousands of ground, airborne, and space-based instruments. GEO is focused on enhancing the development and use of Earth observations in nine Societal Benefit Areas (SBA): Agriculture, Biodiversity, Climate, Disasters, Ecosystems, Energy, Human Health, Water, Weather
1.2 GEO Task US-09-01a
The objective of GEO Task US-09-01a is to establish and conduct a process to identify critical Earth observation priorities within each Societal Benefit Area (SBA) and those common to the nine SBAs. Many countries and organizations have written reports, held workshops, sponsored projects, conducted surveys, and produced documents that specify Earth observation needs. In addition, researchers and practitioners have also identified and recommended key Earth observation needs in publications and peer-reviewed literature. Task US-09-01a focuses on compiling information on observation parameters from a representative sampling of these existing materials and conducting analyses across the materials to determine priority observations.
- 10-year implementation plan note.
1.3 Purpose of Report
The primary purpose of this report is to articulate the critical Earth observation priorities for the Human Health SBA, specifically Air Quality as it affects health and well-being. The Human Health SBA EO priorities are addressed by two additional reports within GEO Task US-0901a: Infections Diseases and Aeroallergens . The intent of the report is to describe the overall process and specific methodologies used to identify documents, analyze them, and to determine a set of Earth observation parameters and characteristics. The report describes the prioritization methodologies used to determine the priority Earth observations for this SBA. The report also provides information on key challenges faced, feedback on the process, and recommendations for process improvements.
The primary audience for this report is the GEO User Interface Committee (UIC), which is managing Task US-09-01a for GEO. The GEO UIC will use the results of this report in combination with reports from the other eight SBAs. The GEO UIC will perform a meta-analysis across all nine SBA reports to identify critical Earth observation priorities common to many of the SBAs. Based on the nine SBA reports, the GEO UIC will produce an overall Task US-09-01a report, including the common observations and recommendations for GEO processes to determine Earth observation priorities in the future. The report’s authors anticipate that the GEO Secretariat, Committees, Member Countries, Participating Organizations, Observers, Communities of Practice, and the broader communities associated with the Human Health and other SBAs are additional audiences for this report.
1.4 Scope of Report
This report addresses the Earth observation priorities for the Human Health SBA. In particular, this report addresses the sub-area of Air Quality within the Human Health SBA (see Section 3 for more details). The report provides some background and contextual information about Air Quality and Health. However, this report is not intended as a handbook or primer on Air Quality and Health, and a complete description of the Human Health SBA is beyond the scope of this report. Please consult the GEO website (http://www.earthobservations.org) for more information about the Human Health SBA.
The report focuses on the Earth observations for Air Quality and Health, independent of any specific technology or collection method. Thus, the report addresses the “demand” side of observation needs and priorities. It does not address the specific source of the observations or the sensor technology involved with producing the observations. Similarly, any discussions of visualization tools, decision support tools, or system processing characteristics (e.g., data format, data outlet) associated with the direct use of the observations are beyond the scope of this report.
The term Earth observation (EO) refers to parameters and variables (e.g., physical, geophysical, chemical, biological) sensed or measured, derived parameters and products, and related parameters from model outputs. The term Earth observation priorities refers to the parameters deemed of higher significance than others for the given SBA, as determined through the methodologies described within. The report uses the terms “user needs” and “user requirements” interchangeably to refer to Earth observations that are articulated and desired by the groups and users in the cited documents. The term “requirements” is used generally in the report to reflect users’ wants and needs and does not imply technical, engineering specifications.
Following this introduction, the report discusses the overall approach and methodologies used in this analysis (Section 2). Section 3 describes the Human Health SBA and the specific sub-areas. Section 4 articulates the specific Earth observations on Air Quality for Human Health and well-being. Section 5 presents the priority observations for Air Quality and Health. Sections 6 and 7 present additional findings from the analysis of the documents and any recommendations. The Appendices include the documents cited as well as additional information describing aspects of Air Quality and Human Health and Welfare.
2. Methodology and Process
This section documents the general process followed and describes the specific methodologies used to identify documents, analyze them, determine Earth observation parameters and characteristics, and establish a set of priority Earth observations for this SBA. It (1) outlines the general task process approach, (2) identifies the analyst and the advisory group and (3) describes the methodologies used for this meta analysis, which consist of (a) document selection, (b) an approach for defining and extracting AQ EO needs and (c) analytical methods for prioritizing Earth Observations for AQ.
2.1 Task Process
The GEO UIC established a general, but uniform, process that is to be applied by each of the SBAs. The intent is to ensure a level of consistency across the SBAs. This general process for each SBA involves nine steps, as summarized in the following list:
- Step 1: Identify Analyst and Advisory Group for the SBA
- Step 2: Determine scope of topics within the SBA
- Step 3: Identify documents regarding observation priorities for the SBA
- Step 4: Develop analytic methods and priority-setting criteria
- Step 5: Review and analyze documents for priority Earth observations needs
- Step 6: Combine the information and develop a preliminary report
- Step 7: Gather feedback on the preliminary report
- Step 8: Perform any additional analysis
- Step 9: Complete the report on Earth observations for the SBA
A detailed description of the general US-09-01a process is available at the Task website, http://sbageotask.larc.nasa.gov, or the GEO website. Some steps in the process occurred simultaneously or iteratively, such as identifying documents (Step 3) and reviewing documents (Step 5).
2.1 Analyst and Advisory Group
The Health and Air Quality group included an “Analyst” and an “Advisory Group” to conduct the process of identifying documents, analyzing them, and prioritizing the Earth observations. The Analyst served as the main coordinator to manage the activities.
2.2.1 Analysts
The Analysts for this Air Quality and Health EO Requirement Report were Drs. Rudolf Husar (lead analyst) and Stefan Falke (co-analyst). Rudolf Husar is a Professor of Energy. Environmental and Chemical Engineering and director of Center for Air Pollution Impact and Trend Analysis (CAPITA) at Washingon University in St. Louis, MO. Over the past 35 years Husar conducted parallel research in air pollution (sources, transport, transformations, effects) and in environmental informatics i.e. the application of science, engineering and technology to environmental information processing. Husar has served on committees of NAS, EPA CASAC as well as international advisory groups, including WMO, IGAC. Recently Husar's research group has actively participated in various aspects of the evolving GEOSS, including the GEOSS Common infrastructure (GCI), the Architecture Implementation Pilot (AIP), and the GEOSS Air Quality Community of Practice (CoP). Stefan Falke is a Research Assistant Professor of Energy, Environmental and Chemical Engineering at Washington University in St. Louis and Manager of Geospatial Information Services for Energy and Environment at Northrop Grumman. Stefan serves as co-chair, with Rudolf Husar, of the Earth Science Information Partners Federation (ESIP) Air Quality Workgroup, which fosters interaction among satellite, aerial, surface, and modeled data producers, brokers, and consumers, and that is setting the foundation for an international GEOSS Air Quality Community of Practice. He has also recently been appointed to lead the Atmospheric Science Interest Group within the Working Group on Information Systems & Services (WGISS) in the Committee on Earth Observation Satellites (CEOS) with an initial focus on interoperability in access, tools, and contextual guidance for using remotely sensed atmospheric composition information across multiple countries.
The Analysts prepared this report through funding from EPA, though a subcontract to ERG, Jan Connery, Project Officer.
2.2.2 Advisory Group
The first step in the nine-step GEO Task US-09-01a process is the formation of an expert Advisory Group (AG) that helps identify appropriate documents, provides feedback on the analysis approach and also reviews the preliminary and final reports. For the Air Quality and Health SBA, 18 potential AG members were identified. The sources of AG candidate names came from the UIC, major Agency representatives and the Analyst team. Additional AG candidates were suggested by the AG members themselves. Eleven of the invited candidates responded favorably, two invitations were declined, three candidates did not respond and two candidates are still pending. Effort was made to include representatives from developing nations and to achieve a representation across geographic domains. Additional AG members would be desirable, particularly from developing countries.
The current Advisory Group consists of 11 experts from the field of Health and Air Quality or some subset thereof. Table 1 shows the Advisory Group members, including: Name, GEO Member Country or Participating Organization, Organizational Affiliation, Geographic Region, Specialty/Area of Expertise. Overall, the Advisory Group includes members from 7 countries and 5 continents, including 3 from developing countries. Five AG members have parallel expertise in air quality as well as human health.
Table 1. List of Advisory Group Members*
| Name | GEO Country or Organization | Affiliation | Region | Specialty |
| Jeff Brooks | Canada | Env. Canada | N. America | Air Quality |
| Jack Fishman | US | NASA Langley | N. America | Air Quality |
| Barry Jessiman | Canada | Health Canada | N. America | AQ and Health |
| Patrick Kinney | US | Columbia University | N. America | AQ and Health |
| Jim Meagher | US | NOAA | N. America | Air Quality |
| Rashmi S. Patil | India | IIT Bombay | Asia | AQ and Health |
| Leonora Rojas | Mexico | National Institute of Ecology | N. America | AQ and Health |
| Paulo Saldiva | Brazil | University of São Paulo | S. America | AQ and Health |
| Rich Scheffe | US | EPA OAR/OAQPS | N. America | Air Quality |
| Kjetil Tørseth | Norway | Norwegian Institute of Air Research | Europe | Air Quality |
| Michael Gatari | Kenya | University of Nairobi | Africa | Air Quality |
The primary roles of the AG were to assist in identifying documents, assess methodologies and analytic techniques, assess prioritization schemes, review findings, and review the project report. The primary forms of communication with the AG were email and through the interactive open project wiki page. This report was prepared using an interactive wiki page on the Earth Science Information Partners (ESIP) server. The members of the Analyst group used the wiki to collaboratively create the content, perform the editing and to share the evolving report with the Advisory Group. The open wiki approach also provided a platform for sharing the document as it evolved and for receiving feedback both from the AG and the GEO Air Quality Community of Practice (ESIP Air Quality Work Group). The wiki, being a living, participating document, facilitates future expansion or revision of this Critical Observations for Air Quality beyond the limited period of this initial GEO task.
2.3 Methodology
This section is a summary of analytic methods and approaches the Analyst used to identify documents, analyze them, and establish a set of priority Earth observations. No standard approaches are available for establishing EO requirements and priorities applicable to all SBAs. The GEO Task Leader, Lawrence Friedl, has encouraged the Analysts of each SBA to be innovative and possibly consider multiple approaches toward developing their respective methodologies for EO requirements and priorities. However, strong emphasis was placed on the need to describe and document the chosen methodologies.
2.3.1 Document Selection
This section provides a general description of the process/method/approach the Analyst/AG used to identify documents and select a representative sampling for the analysis. Task US-09-01a methodology recommended the examination of a wide range of publicly available, geographically distributed sources for potentially relevant documents, including: International, regional, and national documents, project reports, surveys, workshop and conference summaries and peer-reviewed journal articles.
For the identification of candidate documents, the Analyst used three sources: documents that were known to the Analyst; documents recommended by the Advisory Group and documents retrieved through online searches. The documents (5) from the Analyst's prior knowledge were based on decades of experience in AQ data analysis, network design and decision support for AQ management. The documents (15) provided by the AG contributed a broad range of educated perspectives as well as geographic coverage of developing countries. The online web searches focused on websites of international, regional, and national organizations engaged in Air Quality and Health, such as WHO, CDC and HEI. Online searches yielded most of the selected documents. The general online searches included search for published articles through Google Scholar and also general Google search using combination of keywords, such as 'air pollution', 'health', 'Africa'.
The above selection process for qualified documents relies on expert judgment and is inherently subjective. Effort was made to select documents that contain specific statements on the EO requirements, documents that report EOs, and documents that discuss EO requirements for AQ. As with previous analyses conducted for other SBAs, documents that contain such complete and directly applicable information were found to be rare. Hence, the key criteria for selection was that the document had to contain references to specific AQ EO parameters and attributes that are either needed or currently in use. In fact, most documents contain information on specific air pollutants, spatial and temporal coverage and resolution, and some information on data quality.
Once a document was identified as relevant it was assigned a number, a hard copy was printed and a table was attached to help the analysts extract the needed information about coverage, spatial and temporal resolution, accuracy and latency for each parameter identified in the document. The table included a form for information about the document: the title, region, document type and AQ subcategory as well as any EO needs. This document information along with an online link to the document was stored on a wiki webpage the group devoted to each document. The wiki pages were used to deposit both structured metadata and also loose annotations on each document. These metadata were contributed by several members of the AQ and Health Analyst group. In this manner, an online catalog of all documents was created.
The EO characteristics extracted from each selected document and deposited in the 'tables', constitute the main source of information for this meta analysis. The EOs are tabulated using the methodology given is section 2.3.2. The EO priorities are then derived using a set of objective and subjective weighing factors described in section 2.3.3.
2.3.2 Analytic Methods for Gathering EOs
The EO Requirements methodology development started with guidance provided by the Task leader in the form of a standard table for recording EOs from the documents. These standardized tables were to be used for each SBA report and intended for cross-SBA integration of the EO needs. During the methodology development, it became evident that additional attributes were required for the AQ EO needs and priorities. This report also benefited from the examination/evaluation of the completed GEO EO Priority Reports for Climate, Energy and Disasters SBAs.
The documents identified in Section 2.3.1 were visually scanned by the Analyst team 3-5 times. The first scan focused on the general suitability of the document for consideration in this assessment as outlined above. During the second scan, detailed data extraction was performed and recorded into the document's metadata record. It yielded a list of AQ-Health-related EOs and other factual data regarding the observations (e.g. coverage, space and time resolution, accuracy, latency, geographic region, document type.. etc). The purpose of the third scan was to seek additional EO requirements that could only be inferred from the documents. The nature of the inference were also noted in the document's metadata record. Since the metadata extraction methodology evolved during the four month analysis period (June-September 2009), the document scans were performed iteratively.
A key aspect of the methodology development consisted of choosing the sub-areas of the AQ domain: Pollutant Emissions, Transport, Ambient levels, Human Exposure. The rationale for choosing this division is stated and described in section 3.2. For each sub-area the EO status and desired requirements were compiled separately. A further subdivision of the user requirements was made by geographic region of World. In the subsequent analysis the user requirements defined along these two dimensions were aggregated to yield the overall needs for Air Quality and Health. The resulting analyzes of the gathered metadata are shown later in Section 3.3.
2.3.3 EO Prioritization fro AQ and Health
The parameters mentioned in each document were pulled together in a master spreadsheet to begin the prioritization process. For a given document, the title, ID given by analysts, region, document type and content type were entered. The parameters for each document were listed as columns and the doc ID number was used as a 'check mark' in the column's grid cell if a particular pollutant was present in the document. A count of each column provided a bibliometric analysis of the most frequently mentioned parameters. The list was then sorted twice, first by content type and then by region. Each region/content type was counted. For each content type, two tables were made with pollutants as the rows and geographic regions of the world as the columns for each content type. One table was for references for each region for each pollutant and the other table was the count that was mentioned for each pollutant for each region for each content type. This aided prioritization by identifying cross-cutting parameters and spatial gaps.
The main purpose of EOs for AQ and Health is to estimate the effects of air pollutants on human health and to help reduce these effects. The air pollution effects on human health are measured by the exposure of population to air pollutants in the ambient air. The exposure of a person is measured as the near-surface concentration of multiple air pollutants integrated over time. Exposure of an entire population is an integral of the individual exposures over space. Hence, the population exposure can be expressed as follows.
PopExposure = int_space int_time sum(C(i,s,t)*w(i))* P(s,t) ds dt = int_space int_time AQI ds dt = <math>Insert formula here</math>
where C(i,s,t) stands for the surface concentration C of an air pollutant, i, at location s and time t. The factor w(i) is health-relevant weight factor for each pollutant. The weighed sum over all pollutants is the chemical air quality index (AQI) to which an individual is exposed. The AQI = sum (C(i,s,t)*w(i)) is the air quality index (AQI) and depends on the chemical pollutant mix as well as space and time. AQI is obtained by direct measurement or alternate means for estimating individual pollutants concentrations (e.g. AQ model or surrogate measurements). The health-relevant pollutant weight factors arise from epidemiological health studies.
P(s,t) is the space and time-dependent population density and the product of AQI*P is the population exposure density for a specific location and time. The exposure of the entire population over time is obtained by integrating the population exposure density over space and time.
The population exposure estimation for the entire global population is currently very uncertain. The overall uncertainty is contributed by the (1) lack of proper chemical measurement methods for the complex mixture of air pollutants; (2) by the poor and highly variable coverage represented by the spatial and temporal integrals and (3) uncertainty of the concentration dose-health response relationship.
Our method of EO prioritization for AQ and Health is based on the above causality-based model: Priority is given to EOs that reduce the uncertainty of population exposure estimation. The exposure uncertainty is separated into the (1) chemical measurements and (2) spatial and temporal coverage. In other words, the highest priority is assigned to EOs that provide the most direct indicator of health effects and also contribute most to the spatial and temporal coverage.
The analytic method for this meta analysis includes multiple factors that are combined to yield a prioritized list of EOs. Combining these factors was accomplished by the use of weights attached to each factor and subsequently adding the weighed contributions to each EO priority. Hence, the outcome of the prioritization was derived from the selection of suitable factors and their respective weights. Selecting the factors that influence the EO needs is based on subjective judgment that is derived from the current understanding of the Air Quality-Health topic. For the derivation of the weight factors effort was made to apply as much as possible objective measures.
The analysts used three factors to prioritize the EO needs. The first was a bibliographic method to determine which pollutants were cited most. The second factor weighted the EOs for their potency (or how close they were to the actual cause of sickness) the EOs for coverage and the third factor weighed the EOs by their coverage.
For the bibliometric methods (OTA, 1986), priority was assigned based on the relative frequency with which an observation was cited by the documents. The pollutant potency factor was taken from health studies (epidemiological). The coverage factor for the EO priorities was based on the 'gap' between the current EO coverage and the desired EO coverage. The longer the gap, the higher is the coverage priority.
3. Air Quality and Health SBA
The distinguishing characteristics of the AQH SBA are: (1) The pollutant classes of most health significance are known from many epidemiological studies but AQH is a relatively narrow subject area compared to other SBAs.
- Well defined needs for atmospheric compositions based on health effects
- Large regional variation in the global coverage of EOs for AQH
These characteristics lead the Analyst team to organize this AQH EO assessment and prioritization document by global sub regions.
Additional sub-division EOs along the
- Causality chain: Emission, Transport, Ambient, Exposure
- End Uses: Informing Public, AQ Management, Science
Progress on improving air quality and decreasing acidic and toxic deposition (AQ) has been made in many parts of the world, particularly over North America and Europe, although problems persist or are getting worse in some less developed countries. The reductions in emissions that have brought about AQ improvements were motivated by scientific evidence of adverse impacts to health and welfare and have been accomplished through implementation of science-based policies and/or advances in technology nations.
Air pollution is caused primarily as the result of human activities and also mitigated by societal actions for reducing the levels of air pollution.
In the industrial world, the overwhelming majority of air pollution is caused by the combustion of energy-producing fossil fuels, coal, oil and natural gas.... hence the link to energy SBA,
Air pollutants also participate in the human-induced changes in the atmosphere hence climate link (visibility, dimming, global warming).
Air pollution also causes ecological effect (through acidification, ozone damage) ... link to ecosystems SBA
In many areas of the world, the ambient pollutants originate from biomass burning (agricultural), forest, Savannah or agricultural fires or dust storms. ... links to disasters SBA.
AQHI=10/10.4*(100*(EXP(0.000871*NO2)-1+ EXP(0.000537*O3)-1 + EXP(0.000487*PM2.5)-1))
3.1 Air Quality and Health Description
The Health SBA aims to understand and quantify the environmental factors affecting human health and well-being. According to the GEO 10-Year Plan Implementation Plan:
Health issues with Earth observation needs include: airborne, marine, and water pollution; stratospheric ozone depletion; persistent organic pollutants; nutrition; and monitoring weather-related disease vectors. GEOSS will improve the flow of appropriate environmental data and health statistics to the health community promoting a focus on prevention and contributing to the continued improvements in human health worldwide.
The Air Quality and Health is a sub-area of the Health SBA. It examines the role of outdoor air quality for human health and well-being.
3.2 Air Quality Sub-Areas
Earth Observations for Health and Air Quality are not uniformly distributed. For this report, the Analysts classified priority EOs for different geographic regions using the physical breakdown shown in the table below. Earth Observations are needed at each stage from the emission of the pollutant to the population exposure. HEI Accountability Chain
3.2 Earth Observations: Types and Quality
Earth observations for Air Quality and Health have many dimensions, or facets, and therefore require a range of attributes for a full characterization and description. The natural dimensions of EOs are captured by measured parameters as well as their spatial and temporal extent. Each physical dimension is also characterized by the resolution of the observation, i.e. spatial and temporal resolution, and the possible grouping/lumping/binning of the measured parameters. Other facets of EOs include relevancy to the application, data quality, tracability, timeliness, etc.
For the most part, EOs cannot be used directly as raw data for decision making. Value adding processes (data filtering, aggregation and fusion) are needed to derive decision-ready products. The complementary use of EOS with air quality models is particularly important given the model’s potential to characterize multiple pollutant species across variable spatial and temporal scales. The more difficult characterization of EOs is along the value chain from the raw observed data to the derived information and knowledge that is useful for decision making. A typical derived parameters is the air pollution index, an aggregate of multiple air pollutant concentrations, that informs the public on the general level of air pollution and facilitates personal decision making. Similarly, compliance with an AQ standard (derived from multi-year data series) informs an air quality manager whether an AQ control action is required.
3.2.1 Air Quality Parameters
3.2.2 Air Quality Observation Coverage - Global, Regional
3.2.3 Air Quality Process - Emission, Transport, Ambient, Health
3.3 Documents - Popularity
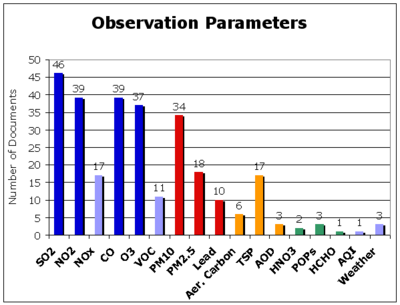
Table 4. Documents measuring Earth Observations for Pollutants
| ' | Africa | Asia Non SE | Asia Southeast | Europe | Interntional | N. America | S. America |
| SO2 | 32,52,53,56,57,58,64,68,69 | 65,73,90,91 | 19,39,50,51,74,75,76,77,78,79,80,81,83,84,86,88,89,92 | 4,6,60,61,94 | 18 | 8,22,26,27,28,43,95 | 48,66 |
| NO2 | 32,52,53,56,58,64,68 | 65,71,90 | 19,39,50,51,74,75,76,77,78,79,80,81,84,86,88 | 4,6,60,61,94 | 18 | 8,22,26,27,28,43,95 | 66 |
| NOx | 32,58,69 | 73,91 | 19,39,75,83,89,92 | 6,60,61,94 | 18 | 27 | |
| CO | 15,32,52,58,64,68,69 | 65,71,73,90,91 | 19,39,50,74,75,76,77,79,80,81,83,84,88,89,92 | 6,60,61,94 | 18 | 8,26,27,43,95 | 48,66 |
| O3 | 15,32,52,58,64 | 71,73,90,91 | 19,39,74,75,76,77,78,79,80,81,83,84,89 | 6,60,61,94 | 13,18 | 8,12,22,26,27,28,43 | 48,66 |
| VOC | 15,32,52,58,69 | 73,91 | 6,60,61,94 | ||||
| PM10 | 32,52,56,64 | 71,73,90,91 | 19,50,51,75,76,77,78,79,80,89,93 | 4,6,60,61,94 | 13,17,18 | 8,22,26,27,44 | 48,66 |
| PM2.5 | 56 | 73,91 | 80 | 4,6,60,61,94 | 14,17,18 | 8,12,26,27,28,44 | |
| Lead | 64 | 72 | 19,39,75,80,83 | 37,94 | 26 | ||
| Aer. Carbon | 68 | 83 | 4 | 14 | 26 | 66 | |
| TSP | 53,57 | 65 | 39,74,75,77,80,81,82,83,84,86,88,92,93 | 66 | |||
| AOD | 61 | 26,44 | |||||
| HNO3 | 6 | 27 | |||||
| POPs | 6,62,94 | ||||||
| HCHO | 43 | ||||||
| AQI | 61 | ||||||
| Weather | 91 | 84 | 12 |
3.3.1 Documents by Process
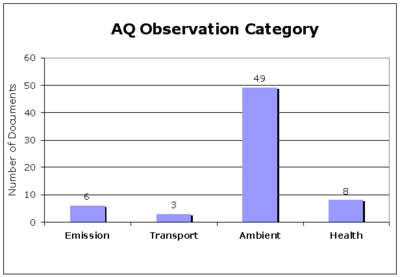
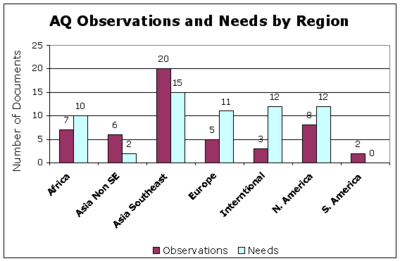
Table 2. Documents with measured Earth Observations by Region for Categories
| ' | Africa | Asia Non SE | Asia Southeast | Europe | Interntional | N. America | S. America |
| Emission | 23 | 19 | 6 | 43,44,95 | |||
| Transport | 23 | 6 | 43 | ||||
| Ambient | 15,23,52,64,67,68,69 | 65,71,72,73,90,91 | 19,50,51,74,75,76,77,78,79,80,81,82,83,84,86,88,89,92,93 | 6,60,61,62,94 | 13,14,18 | 8,22,26,28,27,43,44 | 48,66 |
| Health | 41,51 | 13,14 | 8,22,28, | 48 |
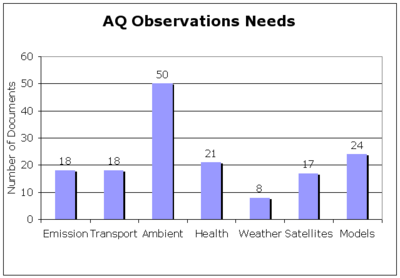
Table 3. Documents with needs for Earth Observations by Region for Categories
| ' | Africa | Asia Non SE | Asia Southeast | Europe | Interntional | N. America | S. America |
| Emission | 20,86 | 9,62,94 | 10,11,17,18,34,45,59 | 7,26,36,38,40,95 | |||
| Transport | 20,74,87,89 | 6,9,62 | 11,17,18,45,59 | 7,26,38,40,42,95 | |||
| Ambient | 1,25,31,52,53,56,57,70 | 72,73 | 20,29,39,41,50,74,82,86,87,88,92,93 | 3,4,6,9,35,37,60,61,62,63 | 2,10,11,14,17,18,33,34,45,59 | 7,8,12,26,36,38,40,42 | |
| Health | 25 | 20,29,41,84 | 3,4,9,35 | 2,10,11,14,33,34,59 | 7,8,12,26,36 | ||
| Weather | 20 | 6,94 | 18,45,59 | 26,40 | |||
| Satellites | 64 | 19 | 6 | 11,17,18,45,46,59 | 26,27,38,40,42,43,44,95 | ||
| Models | 15 | 19,20,84,86,88 | 6,9,60,61,94 | 11,13,17,18,34,45,59 | 7,26,40,42,43,95 |
3.3.2 Documents by Region
| Regions | All References |
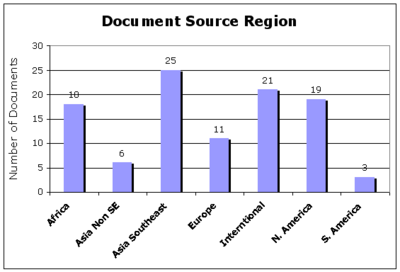
| Africa | 1,15,23,25,31,32,52,53,54,55,56,57,58,64,67,68,69,70 |
| Asia Non SE | 65,71,72,73,90,91 |
| Asia Southeast | 19,20,29,39,41,50,51,74,75,76,77,78,79,80,81,82,83,84,86,87,88,89,92,93,97 |
| Europe | 3,4,6,9,35,37,60,61,62,63,94 |
| Interntional | 2,10,11,13,14,16,17,18,21,33,34,45,46,47,59,98,99,103,105,106,107 |
| N. America | 7,8,12,22,26,27,28,36,38,40,42,43,44,95,96,100,101,102,104 |
| S. America | 48,66,108 |
3.4 Users and uses of Earth Observations for Air Quality and Health
- General public
- Current and forecast air quality including
- Alerts and recommended/mandatory actions during air pollution events
- General causes and pattern of AQ in a neighborhood
- Air quality managers
- Establishing health-based AQ standards through epidemiological studies that relate human health effects to ambient air quality.
- Monitoring for (a) compliance with health-based air quality standards through routine measurement of air quality in polluted and populated areas, (b) Long-term monitoring air quality and tracking of progress toward stated goals of rules, regulations and control strategies.
- Control actions ....
- Scientist
- Research on atmospheric processes including emissions, transport, chemical transformation and removal processes on local, regional and global scales
- Development and evaluation of chemical transport models that are used for forecasting, development of control strategies and national and intentional policies.
- Determination of pollutant effects on human health (e.g. cancer, pulmonary, cardiovascular diseases) and welfare (e.g. acidification, effects on climate, visibility, damage to man-made materials)
- Reporting of air quality information to the public including timely alerts and forecasts as well as historical and regional pattern.
- Observation-based verification of emissions for urban, industrial, agricultural sources as well as from natural sources (forest fires, windblown dust).
- Determination of welfare effects, including terrestrial and aquatic acidification, effects on climate, visibility and damage to man-made materials.
Identifying the key users is a necessity for proper evaluation of their Earth Observation (EO) needs. In this report uses and user categories are represented in a two dimensional matrix. The first dimension is the end-use category. An end user uses the EO for making a personal or societal decision. We consider three groups of end-users of air quality-relevant observations: general public, air quality managers, and air quality policy makers. Each end user group has different information needs. The respective information needs for each end user category will be determined.
The second dimension of EO user classification is along the value chain that transforms the raw observations into suitable information for the decision-makers (end users). Data managers and data flow mediators are a class of users who are responsible for the timely, robust and proper flow of EOs to the SBA application. These users, can be considered part ot the GEO information infrastructure. Intermediate users include researchers, analysts, and modelers who digest and prepare the raw observations in a manner that is suitable for the end-users' decision making needs. The consumers of the processed EOs are the end-users listed above. Classifying users along the value adding chain would aid consistency with the GEOSS data sharing infrastructure, the right information is delivered to the right user. It is here recognized that public documents that explicitly address the information requirements for each user class in the 2D user matrix will be sparse.
- Emphasis on quality control… at all stages of the data flow.
GEOSS 10-Year Plan Reference Document Pg. 43
[earthobservations.org/docs/10-Year%20Implementation%20Plan.pdf GEOSS 10 Year Implementation Plan]
- GEOSS will be a vital means of bringing useful environmental data to the health community in a user friendly form. Comprehensive data sets are powerful tools that support prevention, early warning, research, epidemiology, health care planning and delivery, and provide a variety of timely public alerts. For example, by linking weather, air quality data and the urban heat island effects, air quality forecasts can help protect asthmatics, the elderly and the young from cardiovascular and respiratory problems resulting from air pollution episodes. These data can also provide linkages to longer-term air quality impacts such as cancers, respiratory diseases, asthma and birth defects.
4. Earth Observations for Air Quality and Health
4.1 Observations by Pollutant
4.2 Observation by Coverage
4.3 Observations that are needed for Air Quality Processes
5. Priority Earth Observations for Air Quality and Health
5.1 General Description
5.2 Priority Observations
This section provides summary information of the Health and Air Quality, highlights specific features of the meta-analysis and the broad uses and user-types of Earth Observations in AQ.
EO Regional Requirements
Priority Observations
- Pollutant Potency
- Pollutant Concentration, Dose
- Observation Coverage, Quality
- Observation Category
This section contains the results from the prioritization method(s) applied to the observations identified in section 4.
| Observation Category | Parameter | Aggregated Characteristics of Priority Observation Parameters | |||||
| Coverage/Extent | Spatial | Temporal | Accuracy | Latency | Other | ||
| Air Pollution | PM2.5 | ||||||
| PM10/TSP | |||||||
| SO2 | |||||||
| O3 | |||||||
| NO2/NO | |||||||
| CO | |||||||
| VOCs | |||||||
| Metals | |||||||
| Black Carbon | |||||||
| Airtoxics | |||||||
| NH3 | |||||||
| POPs | |||||||
| Other | Weather | ||||||
| Surface Character | |||||||
| Demographic | |||||||
Summary of Results
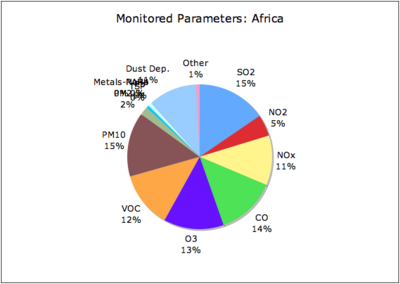
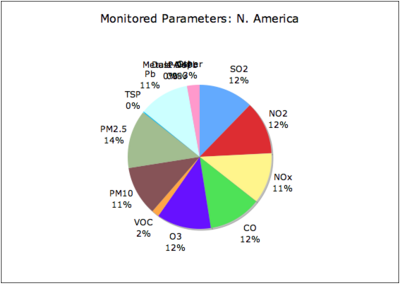
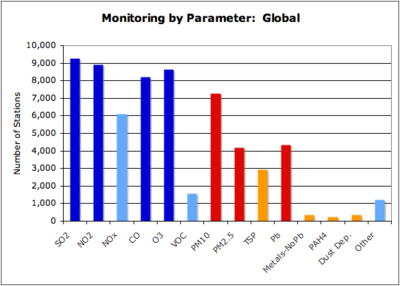
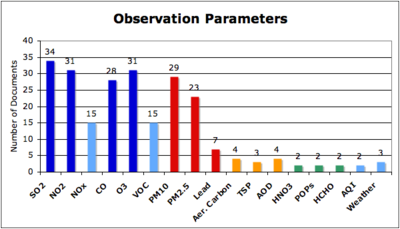
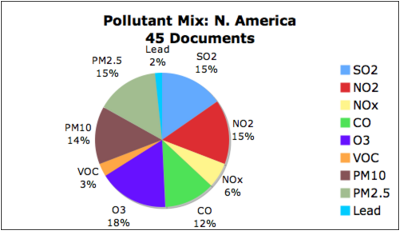
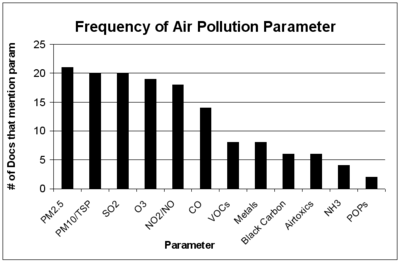
The bibliographic weighting is shown in the figure below for all of the documents analyzed.
Priority observations.
This section contains the specific priority Earth observations for the Air Quality and Health.
Global
Additional Findings
Analyst Comments and Recommendations
Process & Methodology
Challenges (e.g., Advisory Group, Documents, Observations & Meta-analysis)
Appendix
Acronyms
| Abbreviation | Full Name |
| AG | Advisory Group |
| AIP | GEOSS Architecture Implementation Pilot |
| AOD | Aerosol Optical Depth |
| AQ | Air Quality |
| AQ CoP | Air Quality Community of Practice |
| AQH | Air Quality and Health |
| AQI | Air Quality Index |
| CAPITA | Center for Air Pollution Impact and Trend Analysis |
| CASAC | Clean Air Scientific Advisory Committee |
| CDC | Center for Disease Control |
| CO | Carbon Monoxide |
| EO | Earth Observation |
| EPA | Environmental Protection Agency |
| ERG | Eastern Research Group |
| ESA | European Space Agency |
| ESIP | Earth Science Information Partners |
| GCI | GEOSS Common Infrastructure |
| GEO | Group on Earth Observation |
| GEOSS | Global Earth Observation System of Systems |
| HCHO | Formaldehyde |
| HEI | Health Effects Institute |
| IGAC | International Global Atmospheric Chemistry |
| NAS | National Academy of Science |
| NASA | National Aeronautics and Space Administration |
| NH3 | Ammonia |
| NO2 | Nitrogen Dioxide |
| NOx | Nitrogen Oxides |
| O3 | Ozone |
| PM | Particulate Matter |
| PM 10 | PM less than 10 um in diameter |
| PM 2.5 | PM less than 2.5 um in diameter |
| POPs | Persistant Organic Pollutants |
| SBA | Societal Benefit Area |
| SO2 | Sulfur Dioxide |
| TSP | Total Suspended Particulates, PM of any size |
| UIC | User Interface Committee |
| VOC | Volatile Organic Compounds |
| WHO | World Health Institute |
| WMO | World Meteorological Institute |
Bibliography (can be split into the two if desired – not required to do so)
This section can list the documents and references in one list. Or, if preferred, this section can split the documents and references according to those “cited” and those “consulted.”
References Cited
List of the documents cited in the analysis.
References Consulted
<ask limit="5">*"*" is not a number.
Document Region"*" is not in the list (International, Africa, Asia, Non-Southeast, Asia, Southeast, Europe, North America, Oceania/Australia, Polar Region, South America) of allowed values for the "DocRegion" property.Type"*" is not in the list (Report, Workshop, Paper, Website, Presentation, Legislation, Other) of allowed values for the "DocType" property.*</ask> File:Example.jpg
